Bitcoin Tests Resistance: Will the Bulls Break Through or Buckle?


TradingView bets show that after languishing below key resistance levels of $105,000, $107,500 and $108,000, Bitcoin started a fresh recovery wave to rise above $109,500 to surpass $110,000.
A breakout above the $111,250 resistance level could propel the price to new heights. In this scenario, the price may increase and approach the $112,500 resistance level and then the $113,200 mark.
The resistance level for the bullish trend may be $115,000, and a break above that level could propel the price to new highs. However, if Bitcoin does not manage to surpass the $111,250 resistance level, it may initiate a new downward trend.
Current support is positioned around the $108,000 mark, and the next significant support can be found around the $107,500 mark. The subsequent support level is currently around the $106,200 area.
Further declines could push the price down to the $105,500 support level in the short term. The primary support level is at $103,500; if BTC falls below this point, it may face challenges in making a short-term recovery.
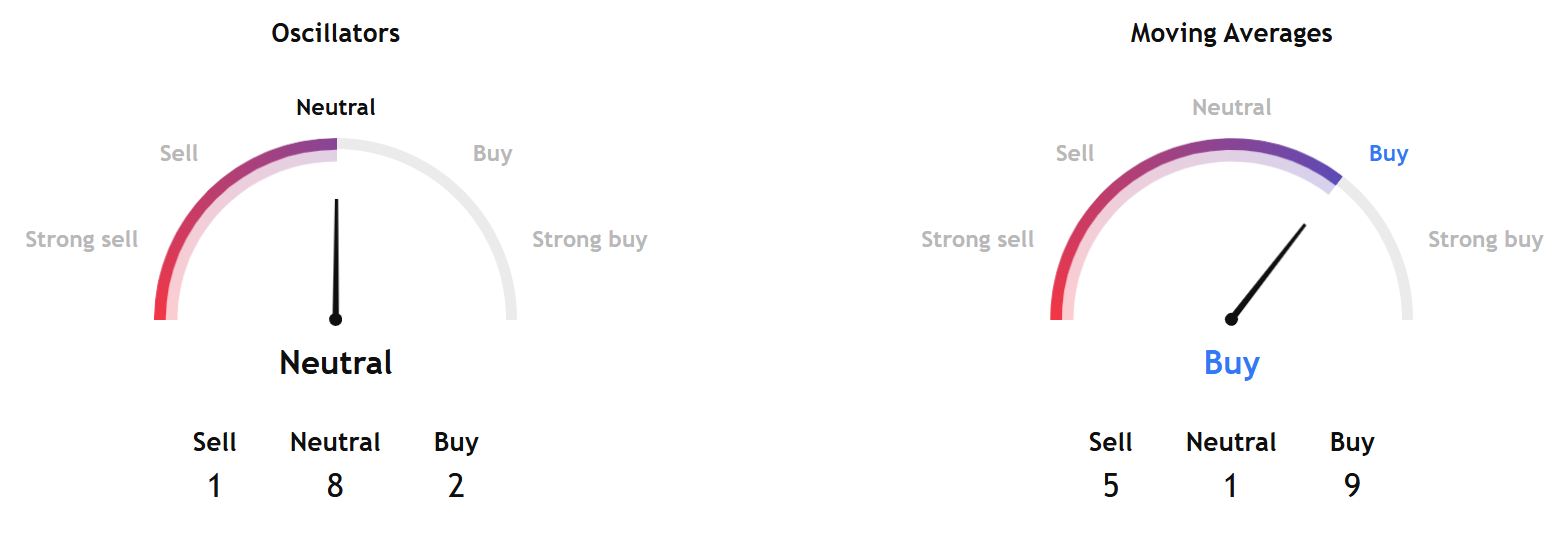
TradingView's technical analysis gauge, based on the most popular technical indicators, such as moving averages, oscillators and pivots, gave a buy signal for BTC over the coming week.
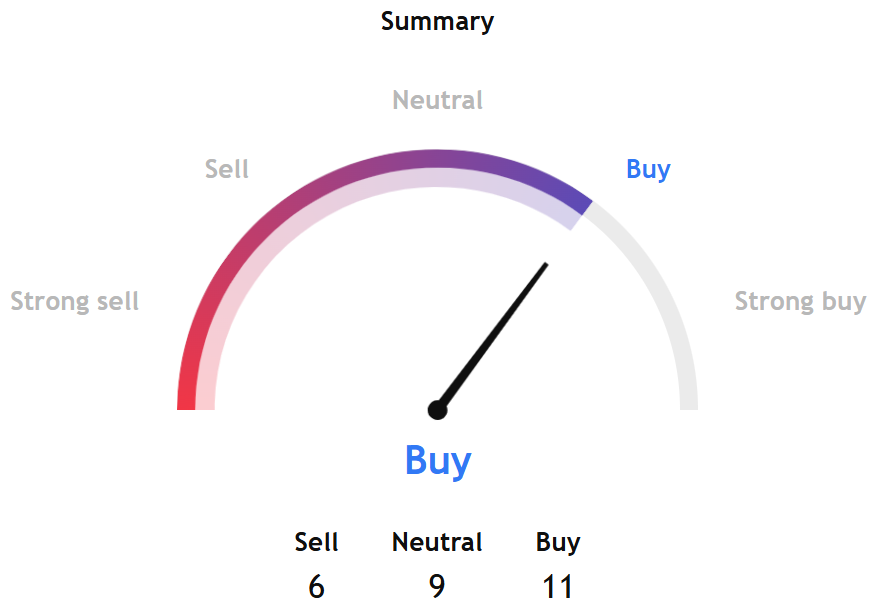
However, the short-term measures pointed to a neutral stance even as the long-term indicators signalled a buy sign.
Separately, InvestTech's Algorithmic Overall Analysis and its recommendation for one to six weeks was positive.
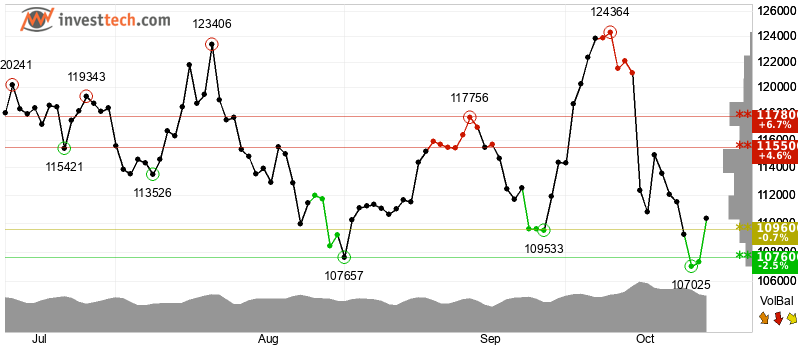
InvestTech said, "Bitcoin is within an approximate horizontal trend channel in the short term. This indicates that investors are uncertain and waiting for signals of further direction. A break upwards will be a positive signal, while a break downwards will be a negative signal. The token has broken through resistance at points $109,600. This predicts a further rise.
The firm added, "Negative volume balance indicates that sellers are aggressive while buyers are passive, and weakens the currency. The short-term momentum of the currency is strongly negative, with RSI below 30. This indicates increasing pessimism among investors and further decline for Bitcoin. However, particularly in big stocks, a low RSI may be a sign that the stock is oversold and that there is a chance for a reaction upwards. The currency is overall assessed as technically positive for the short term."
However, SoSoValue's Daily Total Net Open Interest (Delta), which indicates the difference in the daily changes of open contracts between calls and puts, was -$1.23 billion.
That shows an increase in open contracts for puts, suggesting that market makers need to sell underlying assets to hedge their positions, resulting in the sale of more ETFs.

Markets Hold Breath for CPI, China’s Next Move
Your weekly macro cheat sheet...

From Panic to Stability: Crypto Rebounds as $100 Billion Flows Back Into Market
Your daily access to the back room....

Blockcast 78 | Jeff Feng Talks Sei Network's Vision for the Future of Trading
Sei Labs co-founder Jeff Feng unpacks the core value of blockchain as a trading engine, the strategi...