XRP Price Slips Again, Bears Tighten Grip As Momentum Turns Negative


XRP price started a fresh decline below $2.50. The price is now showing bearish signs and might extend losses below $2.280.
- XRP price is moving lower below the $2.40 zone.
- The price is now trading below $2.40 and the 100-hourly Simple Moving Average.
- There is a key bearish trend line forming with resistance at $2.40 on the hourly chart of the XRP/USD pair (data source from Kraken).
- The pair could start a fresh increase if it clears the $2.50 resistance.
XRP Price Dips Further
XRP price remained below the $2.60 barrier and started a fresh decline, like Bitcoin and Ethereum . The price dipped below $2.420 and $2.40 to enter a short-term bearish zone.
The price even spiked below $2.30. A low was formed at $2.287, and the price is now consolidating losses. There was a minor recovery, and the price tested the 23.6% Fib retracement level of the recent decline from the $2.647 swing high to the $2.287 low.
The price is now trading below $2.40 and the 100-hourly Simple Moving Average. Besides, there is a key bearish trend line forming with resistance at $2.40 on the hourly chart of the XRP/USD pair.
If there is a fresh upward move, the price might face resistance near the $2.40 level and the trend line. The first major resistance is near the $2.450 level, above which the price could rise and test the 50% Fib retracement level of the recent decline from the $2.647 swing high to the $2.287 low at $2.467.
A clear move above the $2.4670 resistance might send the price toward the $2.50 resistance. Any more gains might send the price toward the $2.550 resistance. The next major hurdle for the bulls might be near $2.60.
Another Drop?
If XRP fails to clear the $2.40 resistance zone, it could start a fresh decline. Initial support on the downside is near the $2.30 level. The next major support is near the $2.280 level.
If there is a downside break and a close below the $2.280 level, the price might continue to decline toward $2.250. The next major support sits near the $2.220 zone, below which the price could continue lower toward $2.120.
Technical Indicators
Hourly MACD – The MACD for XRP/USD is now gaining pace in the bearish zone.
Hourly RSI (Relative Strength Index) – The RSI for XRP/USD is now below the 50 level.
Major Support Levels – $2.30 and $2.280.
Major Resistance Levels – $2.40 and $2.450.
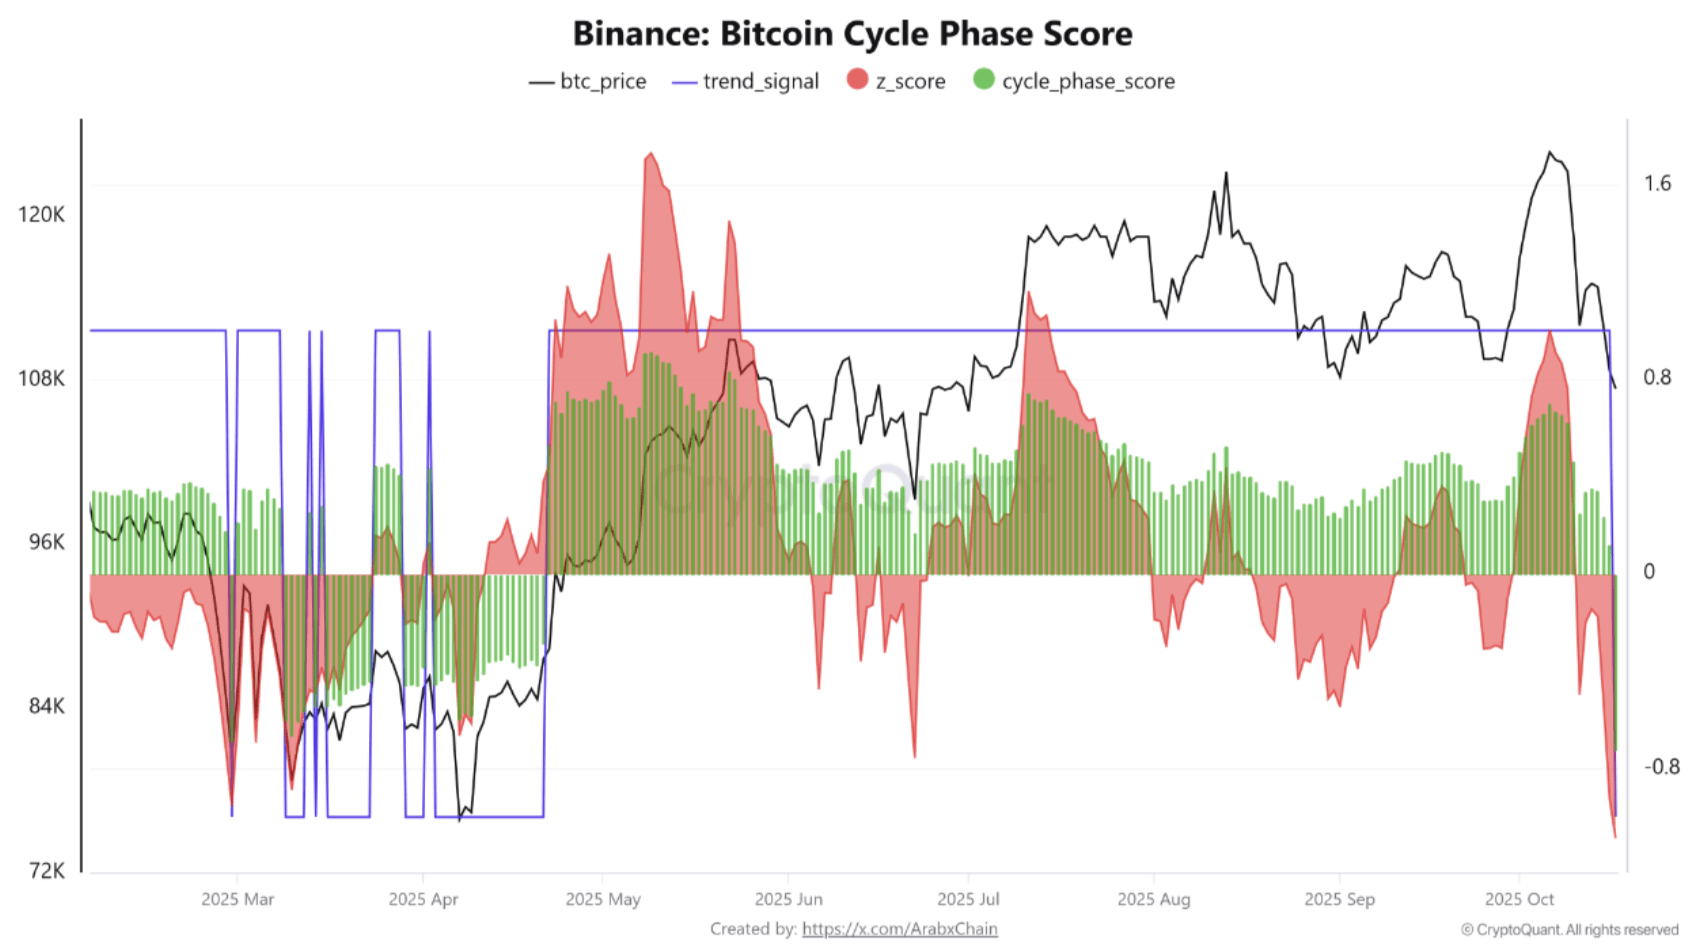
Bitcoin Cycle Score Turns Negative With Trend Below $106,780 – When Will The Correction End?
Bitcoin (BTC) continues to lose momentum, as the flagship cryptocurrency fell to $103,528 earlier to...
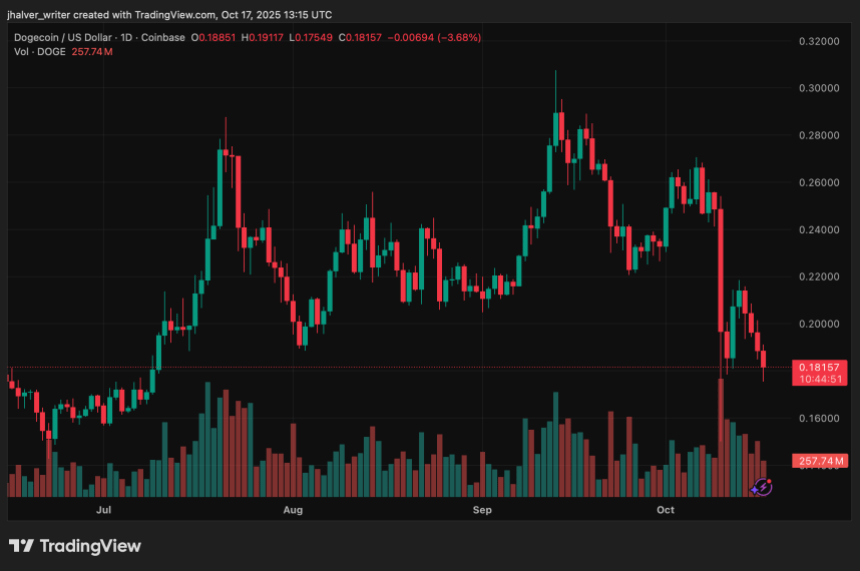
Dogecoin (DOGE) Falls 10% to $0.17 as Whales Dump $74M Despite Nasdaq Merger Hype
In the past 24 hours, Dogecoin (DOGE)’s price slipped another 10% to $0.17, extending a weekly drop ...
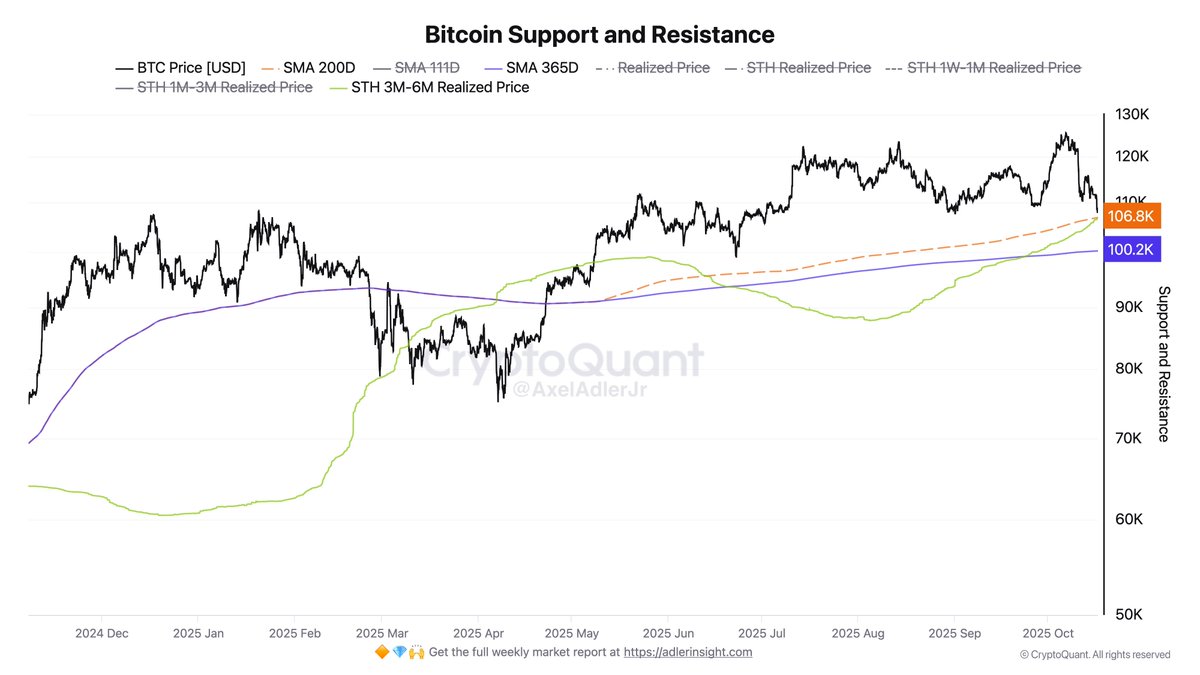
Bitcoin Bulls Rely on STH Realized Price Support Cluster: Loss Could Trigger $100K Retest
Bitcoin is once again under heavy pressure, sliding toward the $103,000 level as the broader crypto ...