How Low Can Bitcoin, Ethereum, and XRP Prices Go? Key Targets Revealed


The post How Low Can Bitcoin, Ethereum, and XRP Prices Go? Key Targets Revealed appeared first on Coinpedia Fintech News
This week’s crypto landscape has become a battleground of bears and battered bulls. As panic selling spurred by geopolitical uncertainities and regulatory crackdowns triggered a broad market sell-off. The global crypto market cap collapsed by 1.97% to $3.76 trillion, echoing a steep 10.88% weekly dive. This is with the CMC20 index off 1.53% and altcoin season at a chilly 27/100. Successively, technical sentiment soured sharply, with an average RSI of 42.59 and fear overtaking greed at a 32 reading.
Bitcoin Price Analysis
Bitcoin is at a critical juncture after tumbling to $111,416.50, losing 1% on the day and 8.67% over the week. The market cap slid to $2.22 trillion while trading volume shrank a dramatic 26.8%. The 4-hour chart reveals persistent bearishness, BTC price action hovers nearly flat along the lower Bollinger Band, signaling oversold conditions. Consequently, the RSI sits at 38.31, well below the midpoint and bordering on oversold territory.
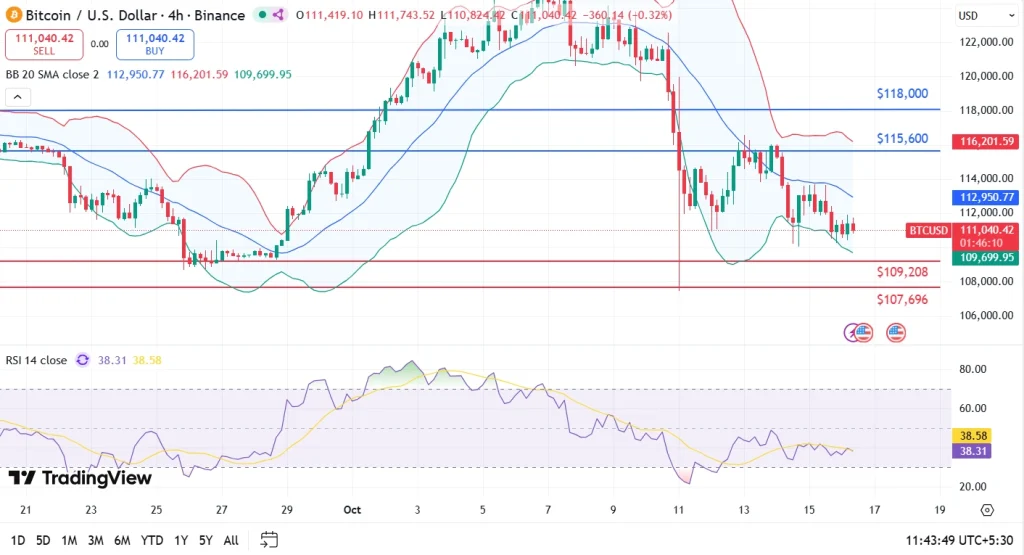
Support is evident at $109,208 and $107,696, if these defenses fail amid continued panic selling and risk aversion, Bitcoin could revisit $107,696 or even lower. Contrarily, the upward resistance remains thicker near $112,950 and $115,600.
Ethereum Price Analysis
Ethereum mirrors Bitcoin’s mood, dropping to $4,017.48, down 2.33% for the day, and 9.63% for the week. Market cap stands at $485.14 billion with volume shrinking almost 30%. The 4-hour chart suggests consolidation near $4,005, where the price fought to hold above key support at $3,955.65. RSI prints at 44.64, underlining the risk for further drops but not yet in deep oversold territory.
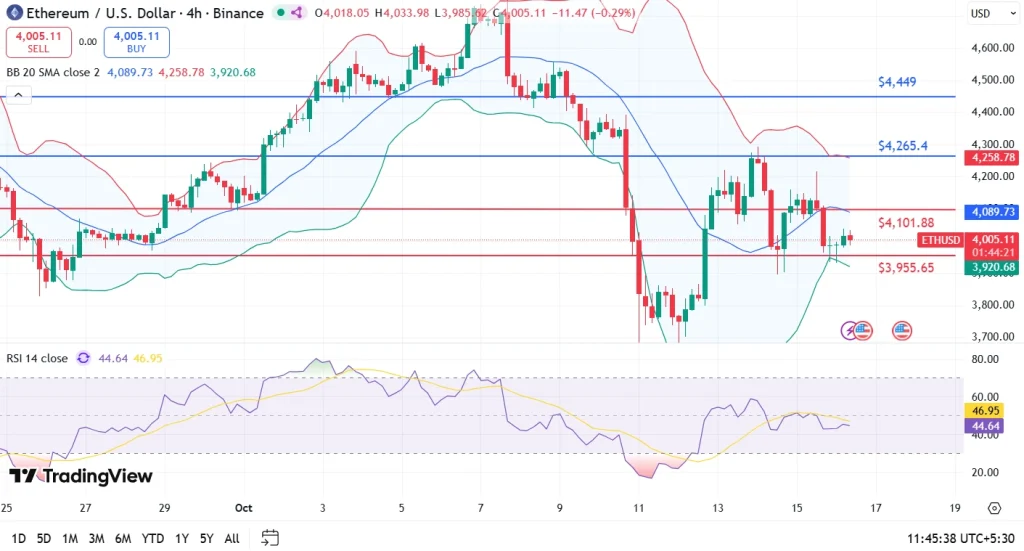
If panic selling persists, Ethereum price may test $3,955 or plunge towards the lower Bollinger Band area around $3,920. Intermediate resistance stands at $4,089.73 and $4,265.40; reclaiming these marks would require a sentiment shift and improved liquidity. Technicals warn of further short-term pressure, especially if global fear intensifies.
XRP Price Analysis
XRP bears the brunt of market stress, collapsing 3.39% in one day and a whopping 14.79% for the week, now trading at $2.41. With a $144.86 billion market cap and volumes thinning, sellers continue to test support near $2.3692. The RSI indicator at 38.20 aligns with severe bearishness, and price action hugs the bottom Bollinger Band.
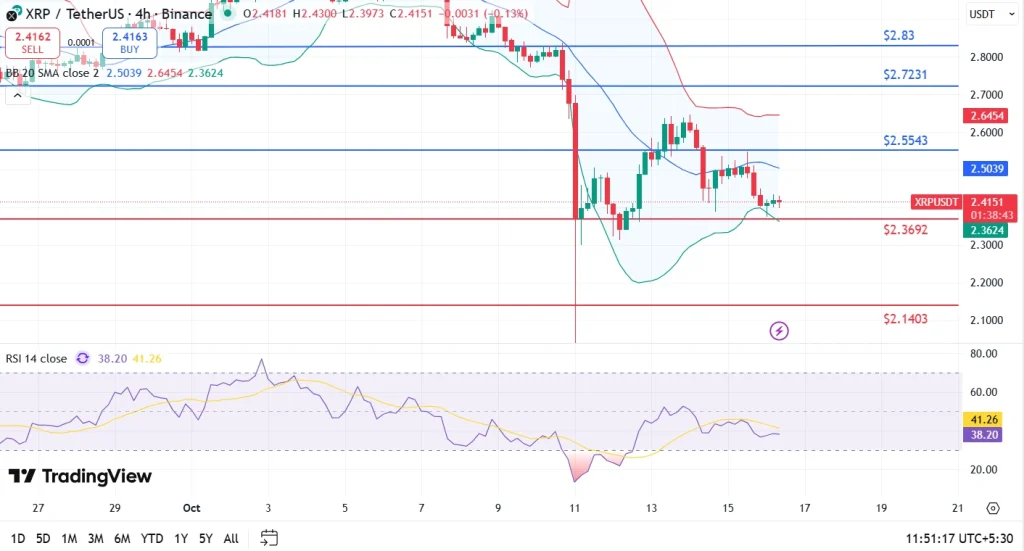
Should regulatory problems or macro tensions deepen, XRP price risks a slide to $2.1403, its next major defense. Recovery faces tough resistance at $2.5039 and $2.5543. Unless sentiment improves and buyers return, the downside pressure could persist, leaving XRP vulnerable to new lows.
FAQs
Sudden liquidations, geopolitical tensions, and regulatory crackdowns trigger panic selling, draining liquidity and overwhelming technical supports.
The low RSI and a fear-heavy sentiment index signal a higher chance of further drops, as buyers are less motivated and sellers dominate.
A swift rebound needs improved macro sentiment, lighter regulatory pressure, and renewed risk appetite. Until then, further downside is likely as technicals struggle to find support.

Binance’s CZ Urges Coinbase to List More BNB Chain Projects
The post Binance’s CZ Urges Coinbase to List More BNB Chain Projects appeared first on Coinpedia Fin...
Chainlink Whales on the Move: Is LINK Price Set for a Major Price Rally?
The post Chainlink Whales on the Move: Is LINK Price Set for a Major Price Rally? appeared first on ...

Innovation Theater: Confusing Token Launches With True Market Success
The post Innovation Theater: Confusing Token Launches With True Market Success appeared first on Coi...