Bitcoin Calm Is Over — ‘Every Time This Happened, Price Went Vertical,’ Says Analyst


Bitcoin is sitting at the “lowest amount of volatility of all time” on the monthly chart, and that historically precedes the cycle’s most forceful upside, according to crypto analyst Kevin (Kev Capital TA). In an October 1 video analysis, Kevin tied an all-time low in the Bollinger Bands Width (BBW) to a long-running pattern across prior cycles and argued that the setup into Q4 leaves “no excuses” for the market not to push higher if key supports hold and the macro backdrop stays benign.
Kevin builds his case around two higher-timeframe indicators: the monthly BBW and the monthly RSI. BBW tracks the distance between the Bollinger Bands rather than plotting the bands themselves; compressed width signals historically low realized volatility and the potential for sharp expansion. “We are at the lowest Bollinger Band width we have ever been at in Bitcoin history,” he said, calling it an inflection that has repeatedly aligned with outsized trend moves.
He pairs that with a monthly RSI that topped in prior blow-off phases and is currently consolidating in what he describes as a bull-flag structure. “Anytime the Bollinger bandwidth percentage gets as low as it is right now… every single time in history on the monthly time frame, we have experienced massive moves higher in the market,” he argued.
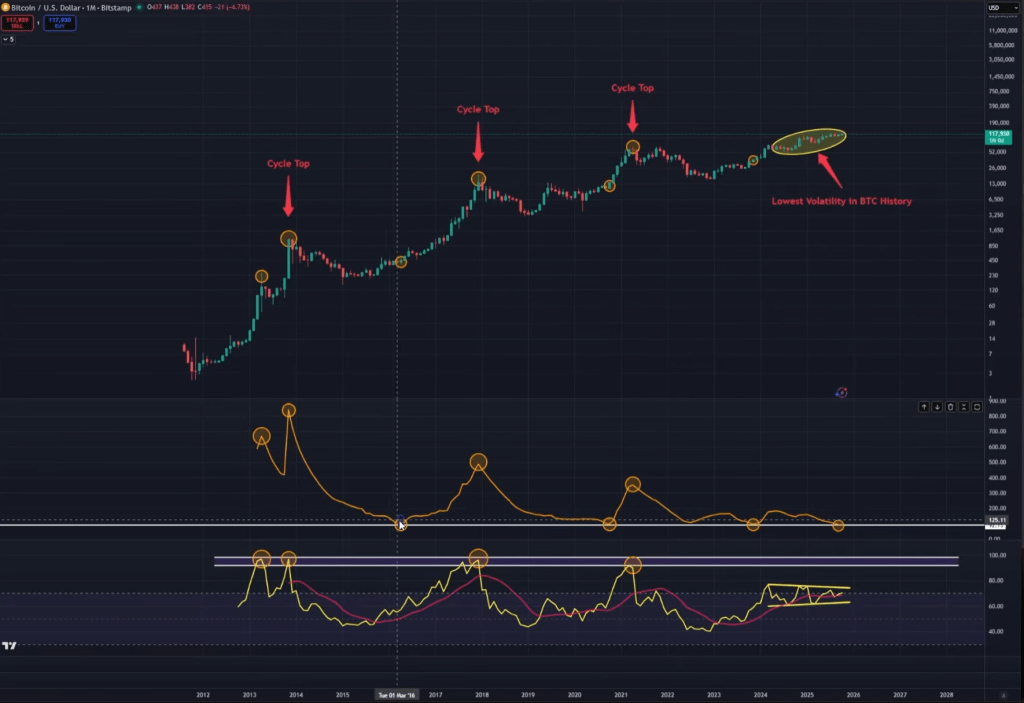
To illustrate the cycle rhyme, Kevin pointed to late 2013 and 2017, when monthly RSI peaked around 96 and 95 respectively while BBW expanded into cycle tops after earlier troughs in volatility. In the subsequent bear-market basing phases, he says BBW fell to cycle lows before fresh expansions began. In the most recent cycle run-up, he characterizes Q4 2023 into March 2024 as the “real rally,” noting that RSI topped near 76 and has since been coiling with “lower highs and higher lows on the monthly RSI… very, very nice looking.”
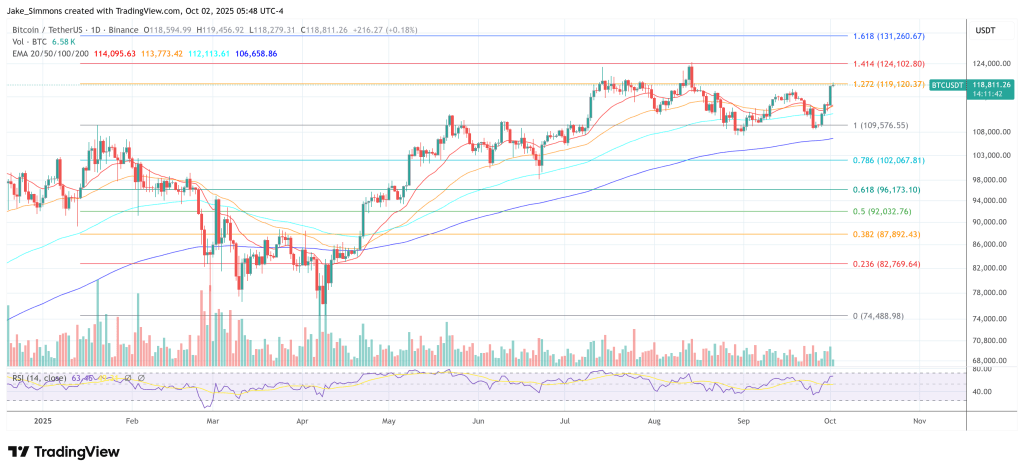
The analyst underlined a key conditional: the technical structure only resolves bullish if Bitcoin preserves its higher-timeframe support. He cites the weekly “ bull market support band ” and nearby horizontal levels as the line in the sand. “As long as Bitcoin can hold key levels, that being the weekly bull market support band, which currently sits at 109.2K, [and] the 106.8K level, then there’s no excuses as to why Bitcoin should not be able to press higher in quarter four,” he said.
What To Watch Now For Bitcoin
Beyond chart structure, Kevin layered in macro and on-chain context as corroborating, not leading, evidence. On macro, his base case is that the policy environment is turning supportive: “We have stable inflation, pretty much flatlined… a weakening jobs market, but not cratering… steady GDP growth, and we have a Fed who’s looking to ease.”
Referencing weaker-than-expected ADP employment data and recent FOMC signaling , he added: “We have a rate cut projected for October… for December… and [possibly] January,” and suggested the Fed’s quantitative tightening could approach an end as bank reserves tighten. He was explicit that the path depends on those conditions persisting: “As long as our macroeconomic landscape here in the US remains favorable… the pathway is laid for crypto to go higher in Q4.”
On valuation and positioning, Kevin turned to a logarithmic regression model of total crypto market capitalization and a “Bitcoin risk metric.” He said total market cap has not yet exceeded his model’s fair-value trendline this cycle—placing fair value at about $4.38 trillion versus roughly $4 trillion for the current reading in his framework—and argued that previous cycle-defining blow-offs began only after crossing above fair value.
“Every single time… we finally broke past the fair value logarithmic regression line, you have seen your biggest moves of the cycle,” he said. His risk metric, color-coded from low to high, currently sits near 0.49–0.50 by his count, well below the 0.8–0.9 “red” zone he associates with durable tops. “Not once this entire cycle has Bitcoin hit basically the red risk level,” he noted, adding that monthly RSI near the high-60s/low-70s is “not seeing parabolic price action… not seeing insane euphoria.”
Exchange behavior is another pillar of his non-top thesis. In prior cycle peaks, he said, net flows of BTC to exchanges surged as participants prepared to sell. “Not only is that not occurring, but net flows are going off of exchanges,” he said. “That is not cycle top behavior. That is accumulation behavior.” The combination—compressed monthly volatility, consolidating momentum, sub-threshold risk, and outflows—leads him to a single conclusion: “There is major volatility coming. If anything, it’s starting now.”
Kevin also acknowledged uncertainties around near-term US economic prints and even government operations, but he returned to the core of his method: synthesizing macro, technicals, and on-chain into a unified cycle view. “We don’t lean in one direction… We put it all together,” he said. Under that blended framework, he contends, calling a cycle top at current levels would “go against every single piece of information we have ever used in the past to determine cycle tops,” and would force a rethink of the model only if the market proves it wrong.
The battle lines, in his telling, are clear. Hold the weekly bands around $109.2K and $106.8K, keep the macro trajectory supportive, and the historical pattern of BBW compression resolving in a powerful, final upside leg should play out as Q4 progresses. Or, as Kevin put it in the line that defined his thesis: “Every time this happened, price went vertical.”
At press time, BTC traded at $118,811.
PrimeXBT Insights: WLFI and the Trump connection, opportunity or just hype?
By Jonatan Randin, Market Analyst at PrimeXBT World Liberty Financial (WLFI) is one of the most high...

Bitcoin Accumulation: Here’s The Massive Tether Buy That Has Got The Community Talking
USDT issuer Tether has added a significant amount of Bitcoin to close out the third quarter, a devel...

Tokenized US Stocks & ETFs Coming To Telegram Wallet Via Kraken & BackedFi
Telegram is taking another step toward bridging traditional finance with crypto. Through a new partn...