Dogecoin (DOGE) Drops Over 5% – Is This the Start of a Bigger Crash?


Dogecoin started a fresh decline below the $0.2650 zone against the US Dollar. DOGE is now consolidating and might dip further below $0.2450.
- DOGE price started a fresh decline below the $0.2620 level.
- The price is trading below the $0.260 level and the 100-hourly simple moving average.
- There is a bearish trend line forming with resistance at $0.2550 on the hourly chart of the DOGE/USD pair (data source from Kraken).
- The price could start a fresh upward move if it stays above the $0.2450 zone.
Dogecoin Price Dips Again
Dogecoin price started a fresh decline after there was a close below $0.2720, like Bitcoin and Ethereum . DOGE declined below the $0.2620 and $0.2550 support levels.
The price even traded below $0.250. A low was formed at $0.2451 and the price is now consolidating losses below the 23.6% Fib retracement level of the recent decline from the $0.2887 swing high to the $0.2451 low. Besides, there is a bearish trend line forming with resistance at $0.2550 on the hourly chart of the DOGE/USD pair.
Dogecoin price is now trading below the $0.250 level and the 100-hourly simple moving average. If there is a recovery wave, immediate resistance on the upside is near the $0.2520 level.
The first major resistance for the bulls could be near the $0.2550 level. The next major resistance is near the $0.2720 level. It is close to the 61.8% Fib retracement level of the recent decline from the $0.2887 swing high to the $0.2451 low. A close above the $0.2720 resistance might send the price toward the $0.280 resistance. Any more gains might send the price toward the $0.2880 level. The next major stop for the bulls might be $0.30.
Another Drop In DOGE?
If DOGE’s price fails to climb above the $0.2550 level, it could continue to move down. Initial support on the downside is near the $0.2450 level. The next major support is near the $0.2320 level.
The main support sits at $0.2250. If there is a downside break below the $0.2250 support, the price could decline further. In the stated case, the price might slide toward the $0.2120 level or even $0.2050 in the near term.
Technical Indicators
Hourly MACD – The MACD for DOGE/USD is now gaining momentum in the bearish zone.
Hourly RSI (Relative Strength Index) – The RSI for DOGE/USD is now below the 50 level.
Major Support Levels – $0.2450 and $0.2320.
Major Resistance Levels – $0.2550 and $0.2720.

Dogecoin Price Could Break Into Double-Digit Rally From This Fibonacci Level
The Dogecoin price has since retraced after its run to $0.3 as sell-offs had grown stronger over the...
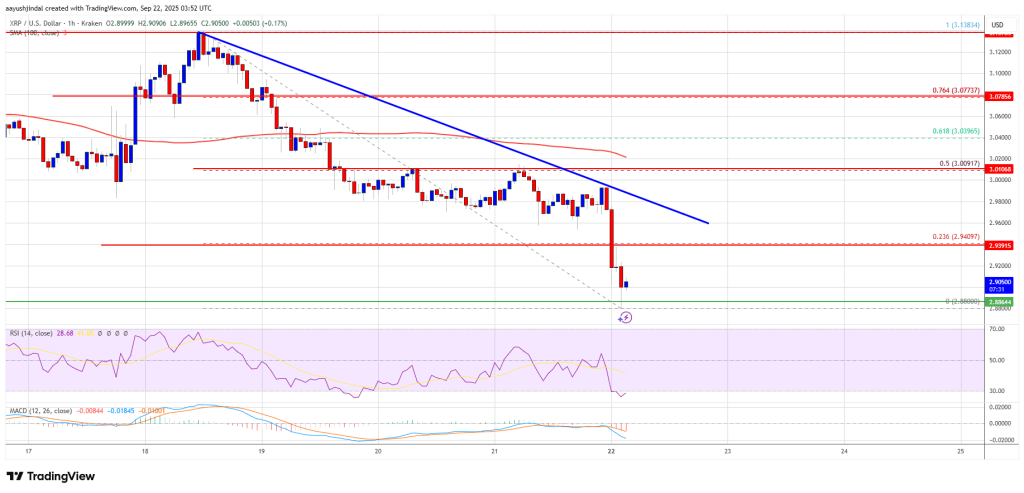
XRP Price Dips Below $3 – Could This Trigger a Bigger Bearish Wave?
XRP price started a fresh decline below the $3.00 zone. The price is now showing bearish signs and m...

Ethereum Price Dives – Can Bulls Step In Before More Damage Is Done?
Ethereum price started a fresh decline below $4,550. ETH is now consolidating and might decline furt...