Solana (SOL) Pushes Higher – Is More Upside Still Ahead?


Solana started a fresh increase above the $220 zone. SOL price is now consolidating above $215 and might aim for more gains above the $225 zone.
- SOL price started a fresh upward move above the $212 and $215 levels against the US Dollar.
- The price is now trading above $215 and the 100-hourly simple moving average.
- There is a bullish trend line forming with support at $222 on the hourly chart of the SOL/USD pair (data source from Kraken).
- The pair could extend gains if it clears the $225 resistance zone.
Solana Price Eyes More Gains
Solana price started a decent increase after it found support near the $205 zone, beating Bitcoin and Ethereum . SOL climbed above the $212 level to enter a short-term positive zone.
The price even smashed the $218 resistance. The bulls were able to push the price above the $220 barrier. A high was formed at $226 and the price is consolidating gains above the 23.6% Fib retracement level of the upward move from the $199 swing low to the $226 high.
Solana is now trading above $215 and the 100-hourly simple moving average. There is also a bullish trend line forming with support at $222 on the hourly chart of the SOL/USD pair.
On the upside, the price is facing resistance near the $225 level. The next major resistance is near the $232 level. The main resistance could be $235. A successful close above the $235 resistance zone could set the pace for another steady increase. The next key resistance is $245. Any more gains might send the price toward the $250 level.
Downside Correction In SOL?
If SOL fails to rise above the $225 resistance, it could start another decline. Initial support on the downside is near the $222 zone and the trend line. The first major support is near the $212 level or the 50% Fib retracement level of the upward move from the $199 swing low to the $226 high.
A break below the $212 level might send the price toward the $205 support zone. If there is a close below the $205 support, the price could decline toward the $200 support in the near term.
Technical Indicators
Hourly MACD – The MACD for SOL/USD is gaining pace in the bullish zone.
Hourly Hours RSI (Relative Strength Index) – The RSI for SOL/USD is above the 50 level.
Major Support Levels – $222 and $212.
Major Resistance Levels – $225 and $235.

Avalanche Foundation Plans $1 Billion Treasury Deals—Can AVAX Take Off?
The Avalanche Foundation is in advanced talks to set up two US digital asset treasury vehicles to ra...

Bitcoin Hyper Presale Explodes with $15M Raise as SEC’s Atkins Unveils Pro-Market Crypto Revolution!
In his latest keynote speech at the OECD in Paris, SEC Chair Paul Atkins reassured that ‘most crypto...
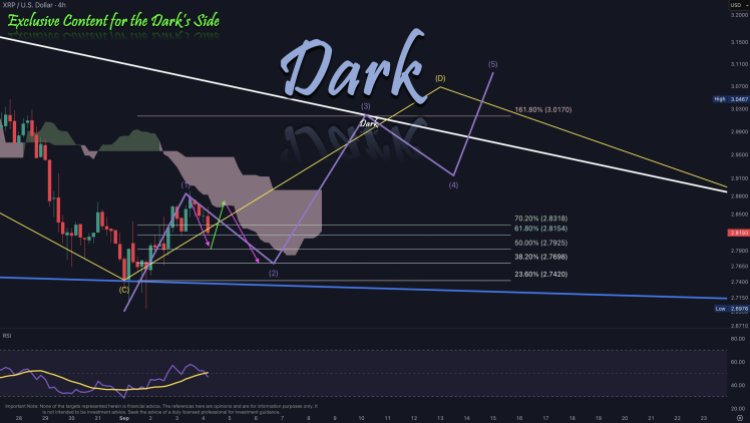
XRP Price Completes Wave 3 Move, Why $3.13 Must Be Broken
With the recent market recovery, the XRP price has been able to confirm an important Wave 3 move tha...