Dogecoin Adam And Eve Pattern Teases Explosive Breakout: Here’s The Price Target


The 12-hour Dogecoin chart shared by the analyst Cantonese Cat (@cantonmeow) maps a textbook Adam and Eve double-bottom that has been forming since early August. The left trough (“Adam”) is a sharp V-shaped selloff into the swing low at $0.18864. The second trough (“Eve”) is a broader, rounded base carved through late August and early September, with price repeatedly defending the lower-mid range around the $0.20–$0.21 band that aligns with the 0.136 Fibonacci retracement at $0.19976 and the 0.236 level at $0.20836.
How High Can Dogecoin Go Short-Term?
In classical charting, an Adam and Eve is a two-stage reversal structure: a fast, vertical capitulation (Adam) followed by a slower, more symmetrical and rounded retest (Eve) that often reflects absorption and basing. The pattern is validated by a breakout through the “neckline,” defined by the intervening peak between the two troughs.
The measured move is typically calculated by adding the height from the neckline down to the Adam low to the neckline level. Failure is generally signaled if price closes back below the Eve trough, while quality improves when the neckline is broken on expanding range and follow-through.
The pattern’s neckline coincides almost perfectly with the 0.618 Fibonacci retracement, plotted at $0.24473. Into the latest 12-hour candles, DOGE has rallied from the rounded “Eve” base to test this band, printing a wick marginally above it before slipping back to trade around $0.241 on the chart. That keeps the market pressing against the neckline formed by the mid-August reaction highs, but not yet conclusively through it.
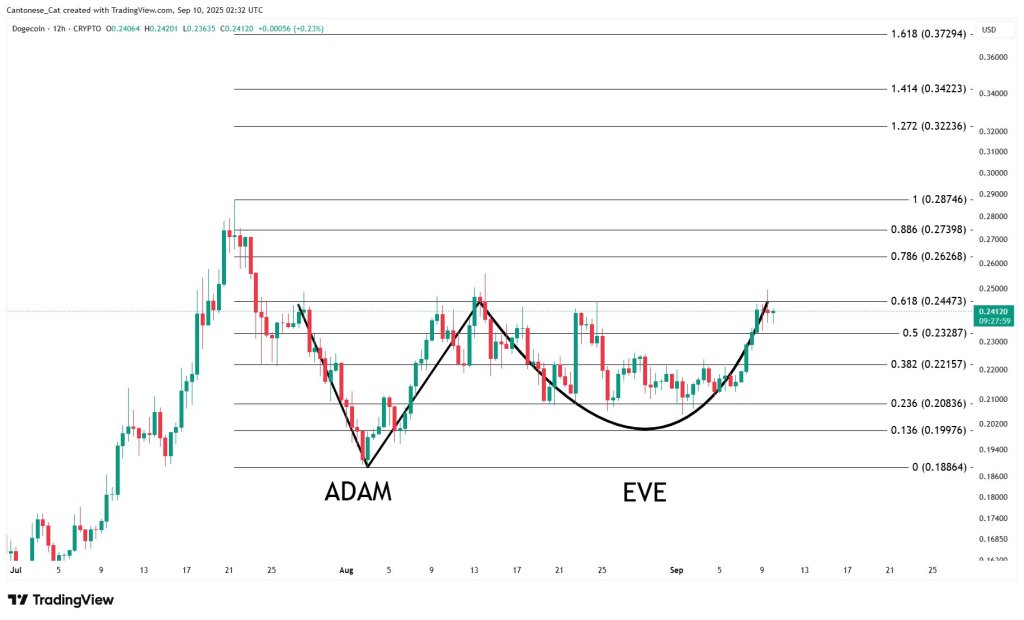
Measured traditionally, the Adam & Eve objective is derived from the height of the structure added to the neckline. Using the chart’s own anchors, the vertical distance from the neckline at $0.24473 to the Adam low at $0.18864 is $0.05609.
Projected upward, that yields a primary price target at approximately $0.30082. This target sits between the Fibonacci extension cluster marked on the chart: the 1.0 extension at $0.28746 and the 1.272 extension at $0.32236, with higher extensions shown at 1.414 ($0.34223) and 1.618 ($0.37294).
The Fibonacci ladder also outlines the near-term battlegrounds . Immediate resistance is the neckline/0.618 at $0.24473. A clean 12-hour close through this band would put the prior swing area at the 0.786 retracement ($0.26268) and the 0.886 retracement ($0.27398) in view, before the chart’s 1.0 marker at $0.28746.
On pullbacks, intermediate supports are layered at the 0.5 retracement ($0.23287), followed by 0.382 ($0.22157), then the 0.236/0.136 pocket at $0.20836/$0.19976. The structural floor of the entire formation remains the August swing low at $0.18864.
In sum, the analyst’s 12-hour map frames DOGE compressing beneath a neckline at $0.24473 after building a two-month Adam & Eve base. The pattern’s measured objective is ~$0.3008, with the chart explicitly marking subsequent Fibonacci waypoints at $0.2875, $0.3224, $0.3422 and $0.3729 on continuation, and support shelves stepping down through $0.2329, $0.2216, $0.2084, $0.1998, to $0.1886 at the base.
At press time, DOGE traded at $0.24.
Ethereum Network Activity Heats Up As Fees Hit $1.4M In 24H
Ethereum has recently come under selling pressure, pausing the relentless bullish momentum that earl...

XRP Influencer Addresses Rumors Of Apple’s $1.5 Billion Buy, What’s The Truth?
Rumors linking Apple to a massive XRP purchase are circulating rapidly through the cryptocurrency co...

Tokenized Stocks Could Be Coming To NASDAQ, Will XRP Benefit From This?
The Nasdaq has filed a proposed rule change with the SEC to list tokenized stocks, marking a signifi...