XRP Price at Tipping Point – Will It Explode or Collapse?


XRP price is attempting to recover above the $2.720 zone. The price is now moving higher and might gain pace if it clears the $2.880 resistance.
- XRP price is attempting to recover above the $2.80 resistance.
- The price is now trading above $2.80 and the 100-hourly Simple Moving Average.
- There is a bullish trend line forming with support at $2.825 on the hourly chart of the XRP/USD pair (data source from Kraken).
- The pair could continue to rise if it stays above the $2.780 zone.
XRP Price Eyes Upside Break
XRP price managed to stay above the $2.70 level and started a recovery wave, like Bitcoin and Ethereum . The price climbed above the $2.75 and $2.80 resistance levels.
There was a move above the 23.6% Fib retracement level of the downward move from the $3.040 swing high to the $2.70 low. However, the price seems to be facing hurdles near the $2.880 level. Besides, there is a bullish trend line forming with support at $2.825 on the hourly chart of the XRP/USD pair.
The price is now trading above $2.80 and the 100-hourly Simple Moving Average. If the bulls protect the $2.780 support, the price could attempt another increase. On the upside, the price might face resistance near the $2.870 level.
The first major resistance is near the $2.920 level or the 61.8% Fib retracement level of the downward move from the $3.040 swing high to the $2.70 low. A clear move above the $2.920 resistance might send the price toward the $2.980 resistance. Any more gains might send the price toward the $3.00 resistance. The next major hurdle for the bulls might be near $3.050.
Another Decline?
If XRP fails to clear the $2.920 resistance zone, it could continue to move down. Initial support on the downside is near the $2.820 level. The next major support is near the $2.780 level.
If there is a downside break and a close below the $2.780 level, the price might continue to decline toward $2.70. The next major support sits near the $2.650 zone, below which the price could gain bearish momentum.
Technical Indicators
Hourly MACD – The MACD for XRP/USD is now losing pace in the bearish zone.
Hourly RSI (Relative Strength Index) – The RSI for XRP/USD is now above the 50 level.
Major Support Levels – $2.780 and $2.70.
Major Resistance Levels – $2.870 and $2.920.
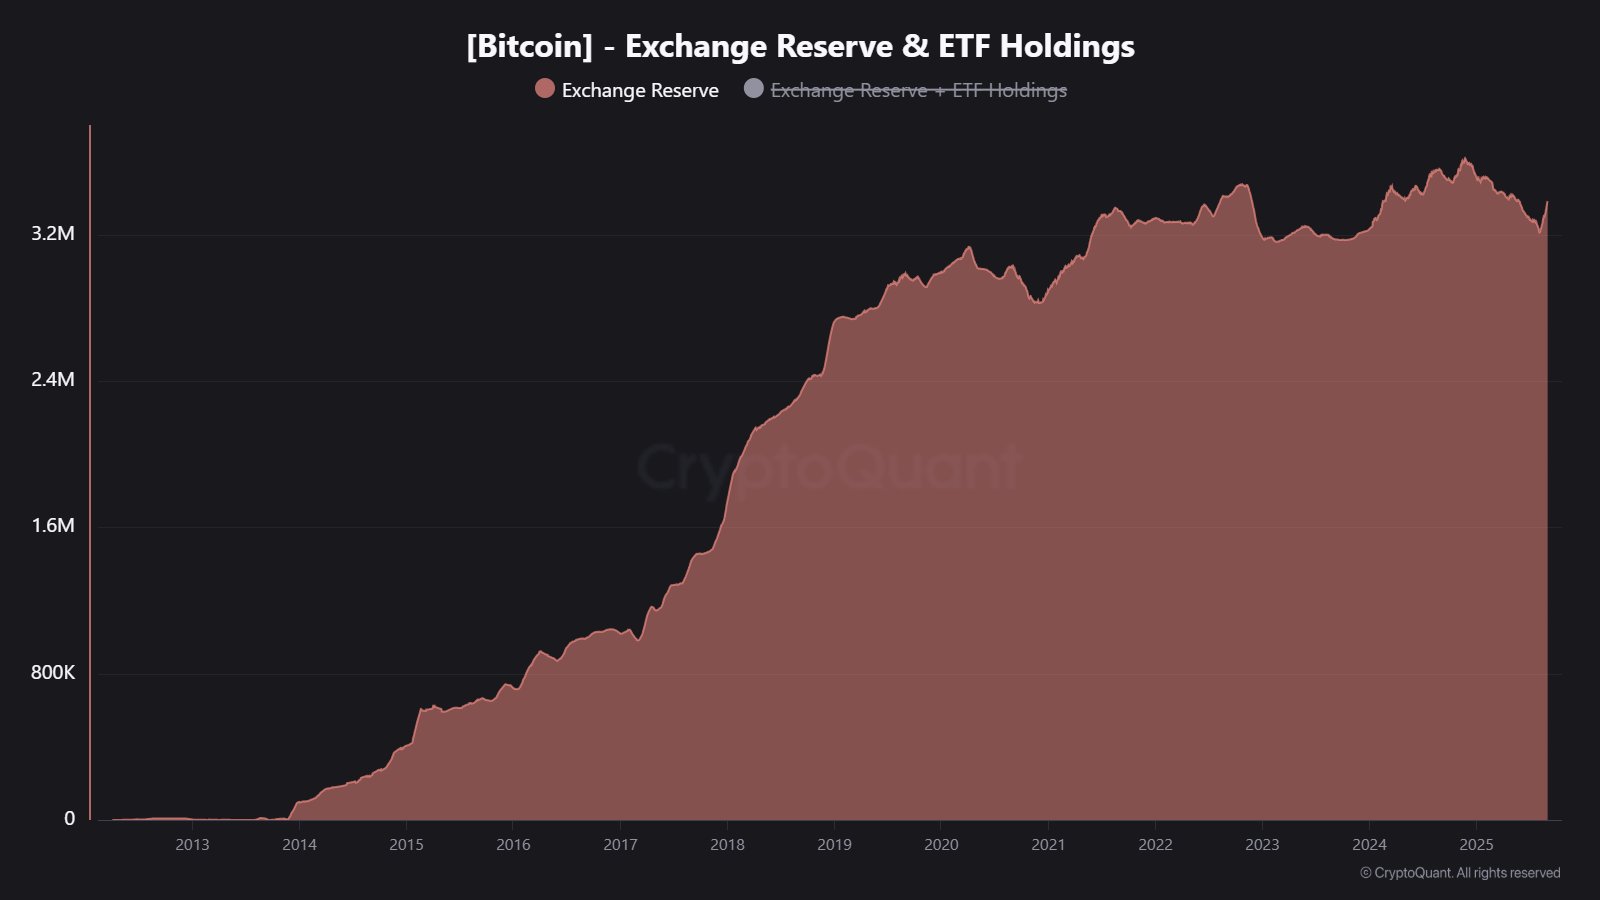
Bitcoin In Trouble? Exchange Reserve Spikes To Highest In Months
On-chain data shows the Bitcoin Exchange Reserve has witnessed a spike recently, a sign that could b...
Strategy Expands Bitcoin Treasury: $450 Million Purchase Sends Total Holdings To New Highs
Strategy, the largest Bitcoin (BTC) treasury company formerly known as MicroStrategy, has reinforced...
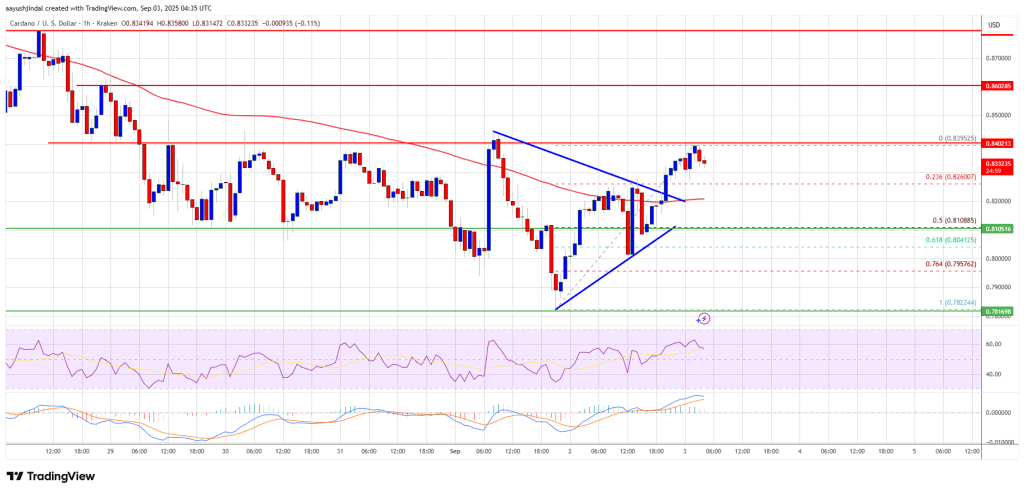
Cardano (ADA) Signals Recovery – Is a Strong Upside Move Ahead?
Cardano price started a fresh recovery from the $0.780 zone. ADA is now rising and might attempt a c...