Bitcoin Taker Buy/Sell Ratio Plunges To Lowest Since 2018: Strong Sell Signal Flashes


Bitcoin is trading at a pivotal level where its previous all-time highs, set in January and May, are now being tested as support. This zone has become a critical battleground for bulls and bears, as fear spreads through market sentiment. Many investors are bracing for further declines, worried that a break below these levels could accelerate downside momentum.
Fresh on-chain data adds weight to these concerns. According to CryptoOnchain, insights from CryptoQuant charts reveal a sharp decline in the 30-day moving average of the Taker Buy/Sell Ratio. This key metric, which tracks whether aggressive buyers or sellers dominate the order book, has fallen to its lowest point since May 2018. The drop signals that selling pressure is overwhelming buyers, even as Bitcoin holds above its former record highs.
What makes this development even more striking is its comparison to November 2021, when Bitcoin last hit all-time highs before entering a brutal bear market. Back then, the ratio was notably higher than it is today, suggesting the market now faces even greater selling dominance. With sentiment fragile and pressure mounting, Bitcoin’s ability to hold these crucial levels may define the next phase of the cycle.
Bitcoin Data Reveals Strong Sell Signal
The latest CryptoOnchain report highlights concerning data from CryptoQuant’s chart , which tracks the 30-day moving average of Bitcoin’s Taker Buy/Sell Ratio. This metric is a reliable gauge of market balance, showing whether aggressive buyers or sellers dominate trading activity. Currently, the sharp decline in this moving average points to a clear weakening of buying pressure. More importantly, the ratio has now slipped below the critical 0.98 threshold — a level widely regarded as a strong sell-off signal.
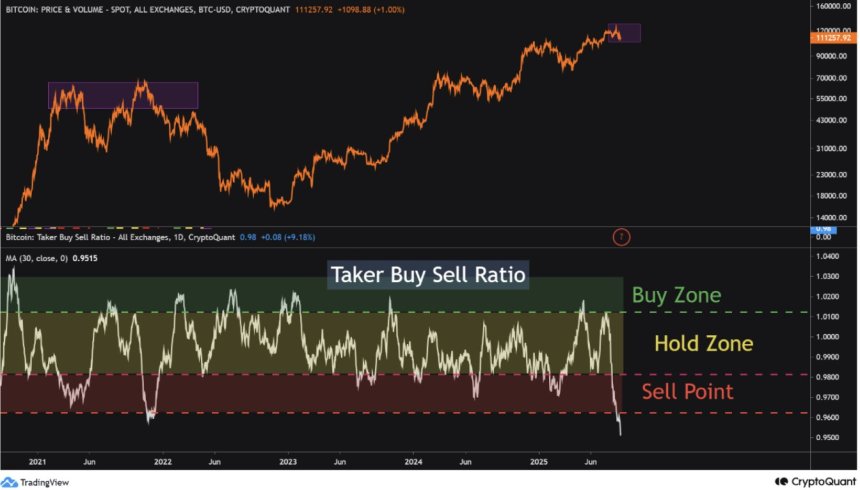
Falling under this line indicates that selling activity is decisively outpacing buying demand. In practical terms, it suggests that the market is leaning heavily toward distribution rather than accumulation, with investors more eager to offload positions than to build them. Historically, when the ratio has dipped to such levels, Bitcoin has struggled to maintain upward momentum and often faced steep retracements.
While Bitcoin’s price has recently held near pivotal support zones, this imbalance between buyers and sellers raises doubts about the sustainability of current levels. The chart reflects an environment where optimism is fragile and downside risks are elevated.
CryptoOnchain explains that the drop in the 30-day moving average of the Taker Buy/Sell Ratio serves as a clear warning. Unless this trend reverses quickly, Bitcoin may be vulnerable to a deeper short-term correction, and potentially the start of a more prolonged downward phase in the cycle.
Bulls Hold Crucial Support After Sharp PullbackBitcoin is currently trading near $111,000 after a volatile retracement from local highs above $123,000 earlier this month. The chart highlights a decisive shift in momentum: after repeatedly failing to break through the $124,000 resistance zone, BTC lost steam and rolled over, triggering a wave of selling pressure.

Price action has since pushed Bitcoin below the 50-day and 100-day moving averages, both now trending downward and reinforcing a short-term bearish outlook. The 200-day moving average around $114,100 is also being tested from below, acting as resistance instead of support. This flip underscores the challenges facing bulls as they attempt to stabilize the market.
For now, BTC is finding support in the $110,000–$111,000 range, a level that coincides with consolidation zones from earlier in the summer. If buyers can hold this line, a relief bounce toward $114,000–$116,000 is possible, though reclaiming those levels will be crucial to regaining momentum.
Failure to defend current support, however, could expose Bitcoin to further downside risk, with the next major demand zone near $105,000. Market sentiment remains fragile, and the inability to clear resistance at $124,000 has shifted focus toward the resilience of support levels in the weeks ahead.
Featured image from Dall-E, chart from TradingView
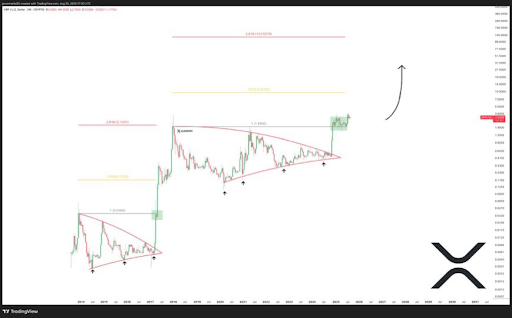
XRP Holds Golden Retrace At $2.90: Wave 3 Breakout To $5.4 In Sight
XRP has been holding steady in recent days, even as Bitcoin dropped to $110,500 and has struggled to...
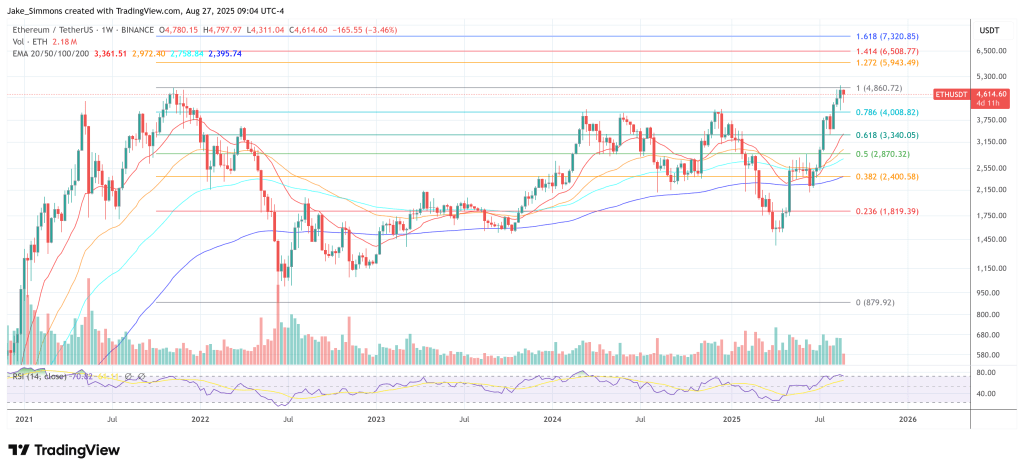
Ethereum To $5,500 In Weeks, $12,000 By Year-End, Tom Lee Predicts
Fundstrat co-founder Tom Lee laid out a forceful, policy-driven Ethereum bull thesis in an interview...

Ethereum Set To Overtake Bitcoin: Why A Price Flippening Is On The Horizon
Ethereum’s rise is accelerating, and the question of whether it will one day surpass Bitcoin in pric...