TRON Spot Market Signals Relief – Seller Dominance Weakens After Cycle High


Tron (TRX) has entered a period of consolidation following its impressive surge to multi-year highs last week. After strong momentum carried prices upward, the market is now moving in a tighter range, reflecting a phase of recalibration. Despite this pause in price action, the overall structure remains bullish, with higher lows and strong resilience from buyers supporting the trend.
Fundamentals continue to play a significant role in driving Tron’s growth. The network’s expanding footprint across decentralized applications, payments, and stablecoin transactions has reinforced confidence among both retail and institutional participants. This resilience has allowed TRX to maintain upward momentum even amid broader market volatility.
Data from CryptoQuant suggests that the current phase may represent more than just consolidation. The metrics point to conditions aligning with the formation of a local bottom region, often a precursor to renewed upward movement. As buyers gradually regain dominance and selling pressure begins to fade, analysts highlight the potential for TRX to extend its bullish trajectory.
Tron Spot Market Signals Local Bottom
According to CryptoQuant analyst Burak Kesmeci, the Spot Taker CVD (Cumulative Volume Delta) has been a highly reliable tool for gauging buyer-seller dominance in the Tron (TRX) spot market over the past year. This indicator tracks whether aggressive buyers or sellers are dominating trades, and its historical performance has produced accurate signals for major price shifts.

One notable example was during November–December 2024, when buyer pressure clearly strengthened. The Spot Taker CVD confirmed this shift, and TRX surged by more than 180% in just a few weeks. This case highlights the indicator’s ability to capture market dynamics at critical turning points.
Fast-forward to August 2025, and the CVD is once again sending important signals. On August 13, 2025, seller dominance reached its highest point in the past year, marking extreme pressure in the market. However, since then, that dominance has begun to weaken, suggesting that selling momentum is fading. Historically, such conditions often precede a local bottom formation as selling exhaustion gives way to renewed buying activity.
Kesmeci points out that the current setup indicates bulls may be regaining strength. If this trend continues, TRX could be on the verge of another strong leg upward. The coming days will be critical, as confirmation of weakening sell pressure may open the door for a renewed rally, further extending Tron’s bullish market structure.
TRX Consolidates Below Key Levels
The daily chart of TRON (TRX) shows the asset consolidating near $0.3567 after reaching new multi-month highs earlier in August. Despite recent pullbacks, TRX continues to trade well above its key moving averages, with the 50-day SMA at $0.3238, the 100-day SMA at $0.2990, and the 200-day SMA at $0.2693. This alignment reflects a strong bullish structure, as the short-term averages remain stacked above the longer-term ones, confirming that momentum is still in favor of the bulls.

The recent consolidation just below $0.38 suggests that TRX is pausing after a strong rally rather than reversing. Price action is holding above the 50-day SMA, which is now acting as dynamic support. If buyers manage to push the price above the recent highs, the next target could be the psychological $0.40 level, with potential continuation toward $0.45.
On the downside, a failure to hold above $0.32 would expose TRX to deeper corrections, with the 200-day SMA near $0.27 serving as a key long-term support. TRX remains in a bullish trend, with consolidation signaling a potential base for the next leg upward. Bulls need to maintain support above $0.32 to keep momentum intact.
Featured image from Dall-E, chart from TradingView
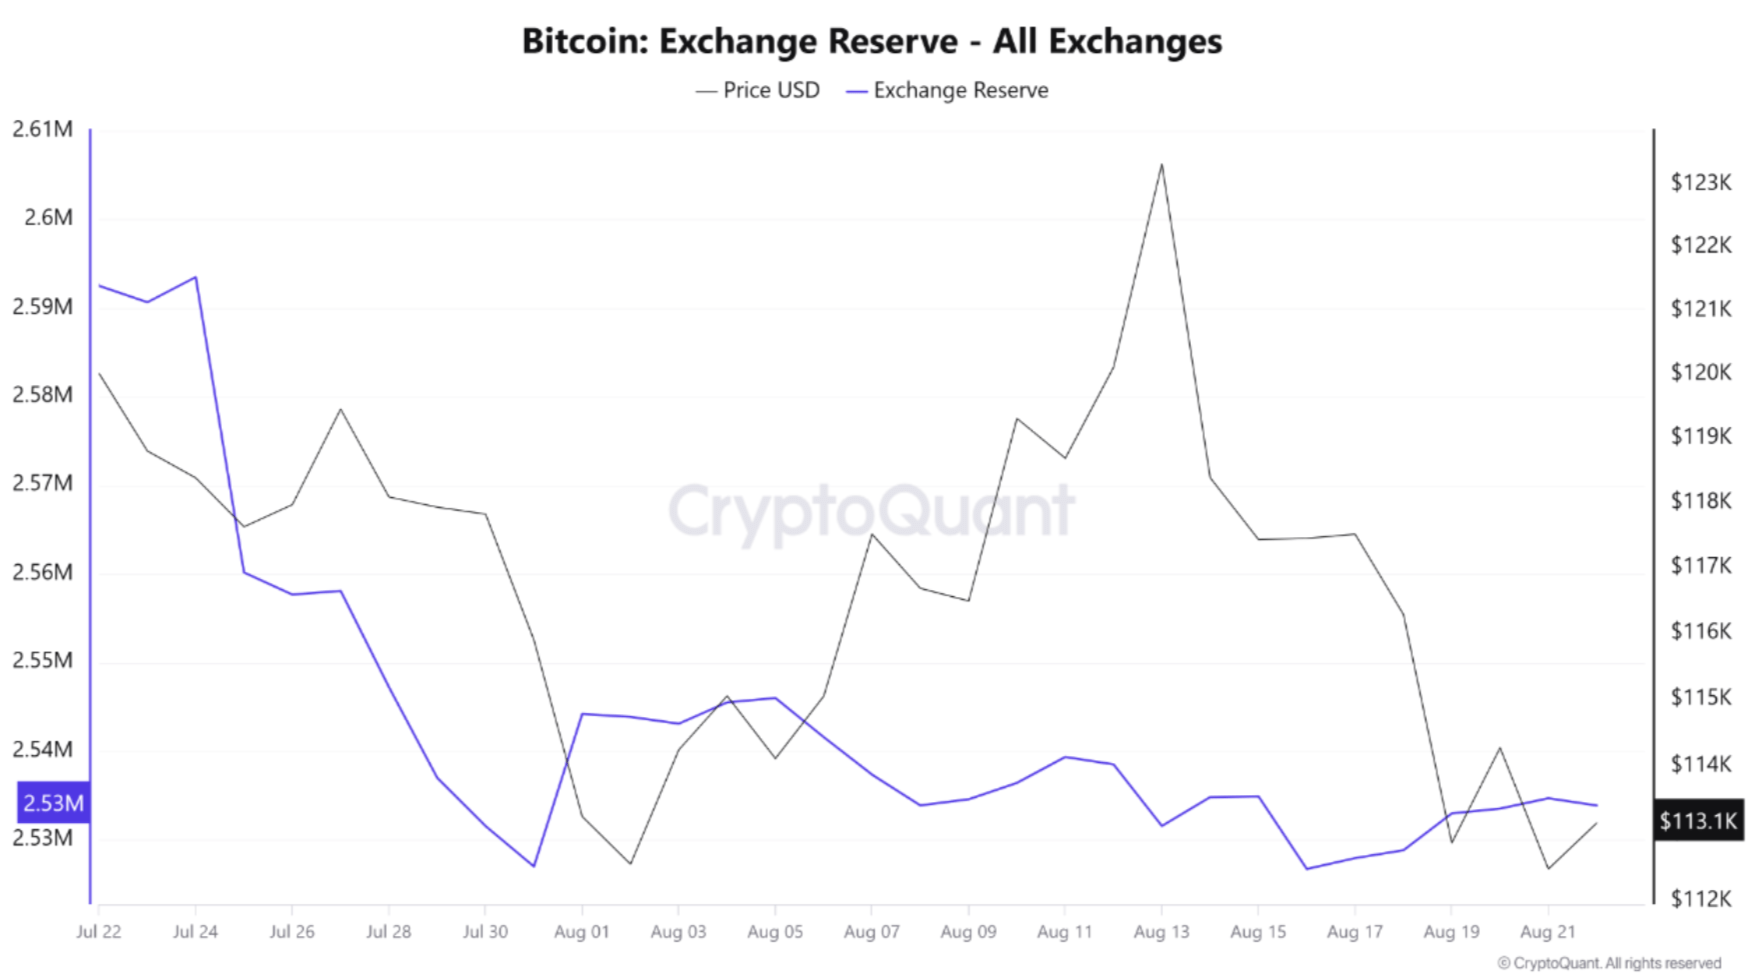
Bitcoin Weakness Vs. Ethereum Strength: On-Chain Data Reveals Divergence
As Bitcoin (BTC) stalls near the $113,000 level, Ethereum (ETH) continues to show strength, highligh...
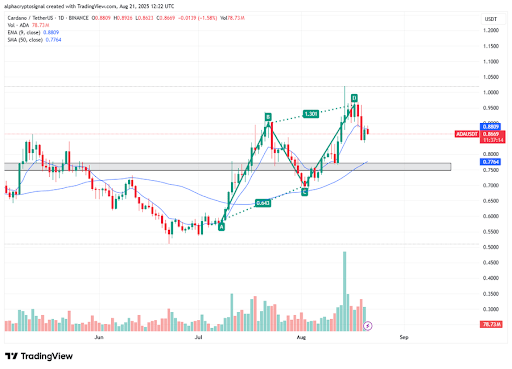
Cardano Price Squeezed Between Support And Resistance – Market Awaits Next Leg
Cardano’s price is caught in a tight range, holding above key support while facing resistance overhe...
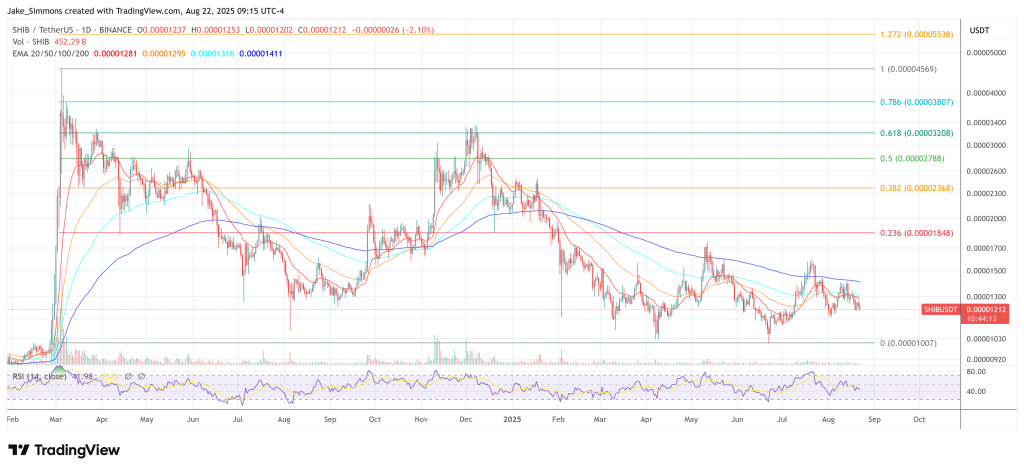
How High Can Shiba Inu Climb In 2025? Analyst Gives Candid Outlook
In a video published earlier this week titled “SHIBA INU — HOW HIGH WILL PRICE BE IN 2025?!! MY HONE...