BNB Price Coiling for Breakout—Next Leg Higher in Sight


BNB price is correcting gains from the $825 zone. The price is now facing hurdles near $815 and might aim for a fresh surge in the near term.
- BNB price is correcting gains and traded below the $815 support zone.
- The price is now trading above $800 and the 100-hourly simple moving average.
- There is a key contracting triangle forming with support at $804 on the hourly chart of the BNB/USD pair (data source from Binance).
- The pair must stay above the $792 level to start another increase in the near term.
BNB Price Holds Support
After a steady increase, BNB price failed to clear the $830 zone. There was a downside correction below the $820 and $815 levels, like Ethereum and Bitcoin .
The price even dipped below $800 and tested $792. A low was formed at $792 and the price is now attempting a fresh increase. There was a move above the 50% Fib retracement level of the downward move from the $827 swing high to the $792 low.
The price is now trading above $810 and the 100-hourly simple moving average. There is also a key contracting triangle forming with support at $804 on the hourly chart of the BNB/USD pair.
On the upside, the price could face resistance near the $815 level or the 61.8% Fib retracement level of the downward move from the $827 swing high to the $792 low. The next resistance sits near the $820 level. A clear move above the $820 zone could send the price higher.
In the stated case, BNB price could test $832. A close above the $832 resistance might set the pace for a larger move toward the $840 resistance. Any more gains might call for a test of the $850 level in the near term.
Another Decline?
If BNB fails to clear the $815 resistance, it could start another decline. Initial support on the downside is near the $804 level. The next major support is near the $800 level.
The main support sits at $792. If there is a downside break below the $792 support, the price could drop toward the $780 support. Any more losses could initiate a larger decline toward the $768 level.
Technical Indicators
Hourly MACD – The MACD for BNB/USD is gaining pace in the bullish zone.
Hourly RSI (Relative Strength Index) – The RSI for BNB/USD is currently above the 50 level.
Major Support Levels – $804 and $792.
Major Resistance Levels – $815 and $820.
Jeff Bezos’ Blue Origin Now Takes Bitcoin, ETH, SOL For Spaceflights
Blue Origin will now sell New Shepard spaceflight seats in Bitcoin, Ethereum, Solana and selected do...

Pundit Predicts ‘Near Term’ Bitcoin And Ethereum Prices, There’s Still Room To Run
Bitcoin and Ethereum prices began to rally over the weekend, and interestingly, ETH was able to beat...
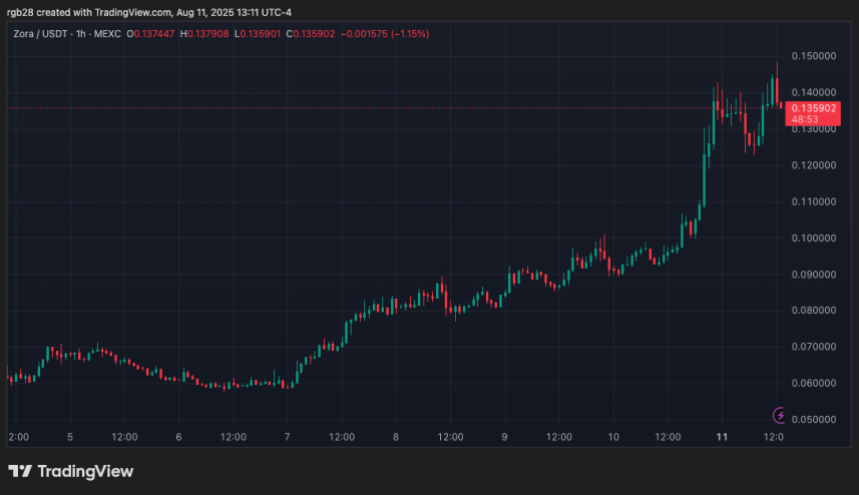
ZORA Hits New ATH Amid 50% Daily Surge – What’s Behind The Breakout?
Social Network Zora has seen its native token, ZORA, record a massive rally following a spike in use...