Cardano Price Today Holds Steady at $0.81: Is a $1 Breakout Next?


The post Cardano Price Today Holds Steady at $0.81: Is a $1 Breakout Next? appeared first on Coinpedia Fintech News
The Cardano price today is trading at $0.8118 after a recent correction of over 12% from the $0.92 level. Despite this recent drop, its long-term technical setups remain unaffected.
In fact, the fall has cooled off its exhaustion from the short-term rally. It suggests that another major bullish structure may be forming, besides the falling wedge.
If this breaks out, then a much larger rally could be on the horizon in the coming weeks. Even experts continue to mention their thoughts on the ongoing falling wedge’s rally, and they are optimistic that soon $1 mark will be flipped.
Cardano Price Today Faces Short-Term Pressure but Holds Long-Term Structure
The Cardano price today showed that it is sustaining after this week’s sell-off, which mirrored broader crypto market weakness, where several major altcoins lost momentum amid fading sentiment.
As a result, the ADA price slipped more than 12% from $0.92 to $0.81, retreating from its previous support near the June highs.
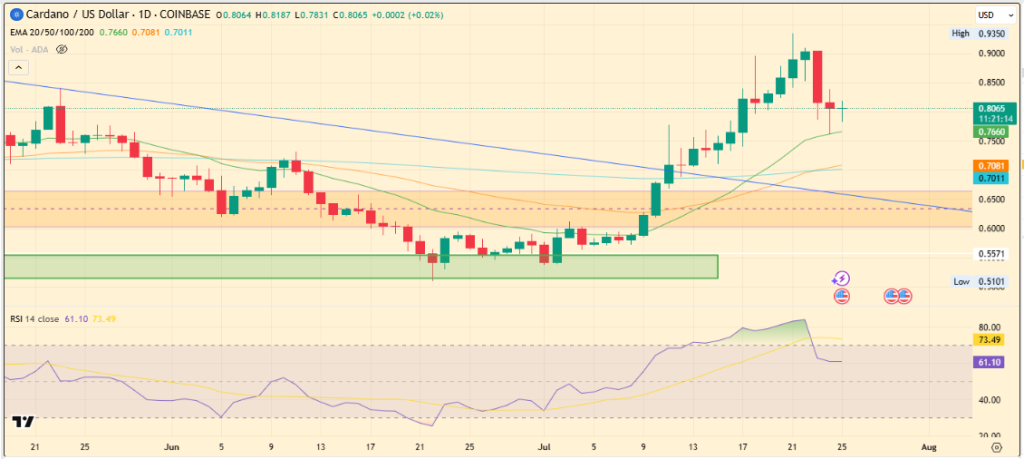
Yet, it has managed to stabilize on the 20-day Exponential Moving Average (EMA), which now acts as its short-term dynamic support.
Adding to this, the 24-hour trading volume has dropped 26% to $1.79 billion. This is signaling reduced participation from both buyers and sellers. While falling volume usually confirms a lack of conviction, but it can also precede a sharp move once direction is confirmed.
Long-Term Patterns Hint at a Potential Reversal
What’s encouraging from a technical standpoint is that despite the recent dip, the Cardano price today is maintaining a broader bullish structure on the daily chart.
A falling wedge formation built after months of bleeding price action from $1.32 high has displayed an breakout in July, which is still intact and ongoing.
Sure looks like we're getting another one of these, doesn't it
— JAVON… $ADA (Cardano) https://t.co/MXXkXyDzFR pic.twitter.com/byvTRKsUuu
MARKS (@JavonTM1) July 24, 2025
Even an analyst, Javon Marks, highlights that this pattern mirrors setups from previous bullish cycles. Where each of those historical patterns was followed by a rally, making this current structure worth watching.
Importantly, the recent sell-off appears to be a sign of a pullback for a much larger momentum ahead. That said, the price decline this week has not invalidated the pattern; instead, it has strengthened it, and the overall structure remains intact.
Symmetrical Triangle Converging with Breakout Path
Apart from the falling wedge, the daily chart showcases another pattern, where the Cardano price today seems to be at the center of the pattern.
This pattern is the multi-month symmetrical triangle. This triangle showed a breakdown in June, but the price re-entered the range, invalidating last month’s breakdown.
Most recently, the sell-off in ADA was also seen from this pattern’s upper boundary, showing its importance in the Cardano price chart.
Even though the symmetrical triangle hasn’t confirmed a breakout yet, it complements the falling wedge pattern, which is already in play.
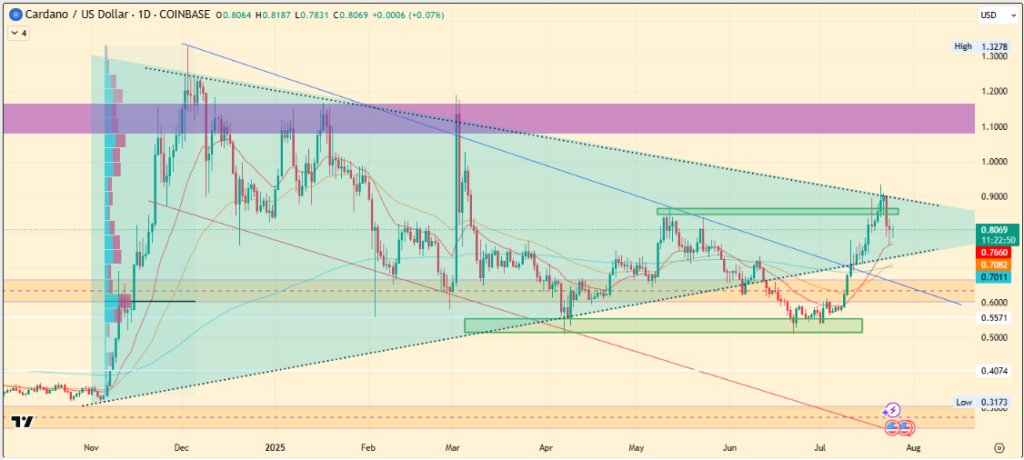
The convergence of both formations, combined with strong historical context, increases the odds of an upward move.
If ADA breaks out of this triangle in the coming weeks, the $1 mark could be the first significant level to test, potentially setting the stage for a broader uptrend.
Additionally, July has already been marked by structural resilience, and the upcoming August could bring additional positive triggers for ADA price action.
Crypto News: Vietnam Launches NDAChain to Enhance Digital Ecosystem
The post Crypto News: Vietnam Launches NDAChain to Enhance Digital Ecosystem appeared first on Coinp...
Hedera Price Surges on Robinhood Listing, Is HBAR Heading to $0.30 Next?
The post Hedera Price Surges on Robinhood Listing, Is HBAR Heading to $0.30 Next? appeared first on ...
Wellgistics Health’s Bold XRP Move: But Is It Real Strategy or Just Investor Buzz?
The post Wellgistics Health’s Bold XRP Move: But Is It Real Strategy or Just Investor Buzz? appeared...