Bitcoin Price Pauses for Breath—Consolidates Gains Before Next Big Move?


Bitcoin price started a downside correction from the $123,200 zone. BTC is now consolidating below $120,000 and might attempt a fresh increase.
- Bitcoin started a fresh decline from the new all-time high near $123,200.
- The price is trading below $119,500 and the 100 hourly Simple moving average.
- There is a rising channel forming with support at $118,200 on the hourly chart of the BTC/USD pair (data feed from Kraken).
- The pair might start another increase if it clears the $120,000 resistance zone.
Bitcoin Price Hits Support
Bitcoin price started a downside correction from the new all-time high at $123,200. BTC dipped below the $122,000 and $120,000 support levels to enter a short-term bearish zone.
The price traded below the 23.6% Fib retracement level of the upward move from the $108,636 swing low to the $123,140 high. However, the downside was limited and the price found support near the $115,800 zone. The bulls protected a move below $118,000.
The price stayed above the 50% Fib retracement level of the upward move from the $108,636 swing low to the $123,140 high. Bitcoin is now trading below $119,500 and the 100 hourly Simple moving average.
There is also a rising channel forming with support at $118,200 on the hourly chart of the BTC/USD pair. Immediate resistance on the upside is near the $119,200 level. The first key resistance is near the $119,500 level. The next resistance could be $120,000.
A close above the $120,000 resistance might send the price further higher. In the stated case, the price could rise and test the $121,200 resistance level. Any more gains might send the price toward the $122,000 level. The main target could be $123,200.
More Losses In BTC?
If Bitcoin fails to rise above the $120,000 resistance zone, it could continue to move down. Immediate support is near the $118,200 level and the channel. The first major support is near the $116,500 level.
The next support is now near the $115,500 zone. Any more losses might send the price toward the $113,500 support in the near term. The main support sits at $110,500, below which BTC might continue to move down.
Technical indicators:
Hourly MACD – The MACD is now losing pace in the bearish zone.
Hourly RSI (Relative Strength Index) – The RSI for BTC/USD is now below the 50 level.
Major Support Levels – $118,200, followed by $115,500.
Major Resistance Levels – $120,000 and $122,000.
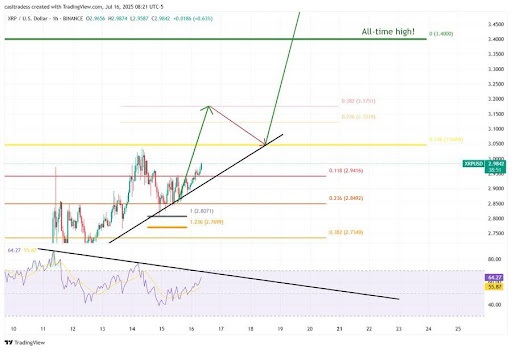
XRP Path To A New All-Time High Is Playing Out Beautifully – Here’s How
XRP’s journey toward a new all-time high is shaping up with remarkable precision. After weeks of ste...
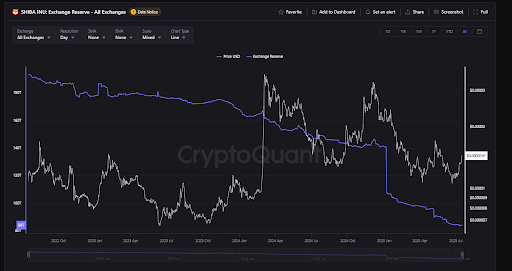
Shiba Inu Exchange Reserves Hit Lowest Level Since 2023 — Why A Price Surge Could Follow
Shiba Inu’s exchange reserves have hit a new low, the lowest level since 2023, providing a bullish o...

Pakistan and El Salvador Team Up on Crypto — What It Means for the Best Presales Right Now
Pakistan and El Salvador have initiated a diplomatic alliance that puts crypto first. It’s the lates...