Bitcoin Price Hits $120K Milestone — Bulls Make History Again


Bitcoin price started a fresh increase above the $116,500 zone. BTC is now up over 2%, traded to a new high, and might extend gains above the $122,000 level.
- Bitcoin started a fresh increase above the $118,500 zone.
- The price is trading above $118,500 and the 100 hourly Simple moving average.
- There is a bullish trend line forming with support at $119,000 on the hourly chart of the BTC/USD pair (data feed from Kraken).
- The pair could continue to rise if it clears the $122,000 resistance zone.
Bitcoin Price Sets New ATH
Bitcoin price started a fresh increase after it cleared the $115,500 resistance zone . BTC gained pace for a move above the $116,000 and $118,500 resistance.
The bulls even pumped the pair above the $120,000 resistance zone. A new all-time high was formed at $122,550 and the price is now consolidating gains above the 23.6% Fib retracement level of the upward move from the $116,679 swing low to the $122,550 high.
Bitcoin is now trading above $120,000 and the 100 hourly Simple moving average . There is also a bullish trend line forming with support at $119,000 on the hourly chart of the BTC/USD pair.
Immediate resistance on the upside is near the $122,550 level. The first key resistance is near the $1123,500 level. The next resistance could be $124,000.
A close above the $124,000 resistance might send the price further higher. In the stated case, the price could rise and test the $128,000 resistance level. Any more gains might send the price toward the $128,800 level. The main target could be $130,000.
Downside Correction In BTC?
If Bitcoin fails to rise above the $122,500 resistance zone, it could start a downside correction. Immediate support is near the $121,500 level. The first major support is near the $119,500 level or the 50% Fib retracement level of the upward move from the $116,679 swing low to the $122,550 high.
The next support is now near the $119,000 zone. Any more losses might send the price toward the $118,500 support in the near term. The main support sits at $116,500, below which BTC might continue to move down.
Technical indicators:
Hourly MACD – The MACD is now gaining pace in the bullish zone.
Hourly RSI (Relative Strength Index) – The RSI for BTC/USD is now above the 50 level.
Major Support Levels – $122,500, followed by $125,000.
Major Resistance Levels – $121,500 and $119,000.
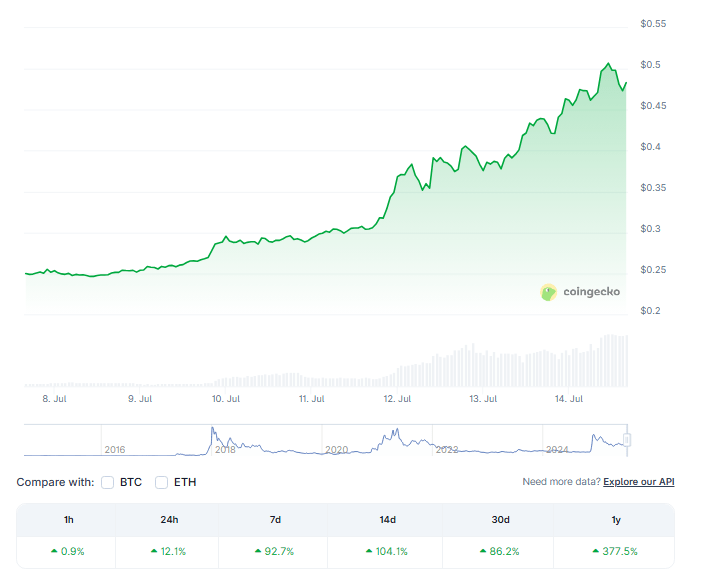
Stellar (XLM) Set To Explode? 92% Rally Sparks Bullish Frenzy—Details
Stellar (XLM) has seen a sudden burst of activity this week. According to recent data, XLM jumped 12...
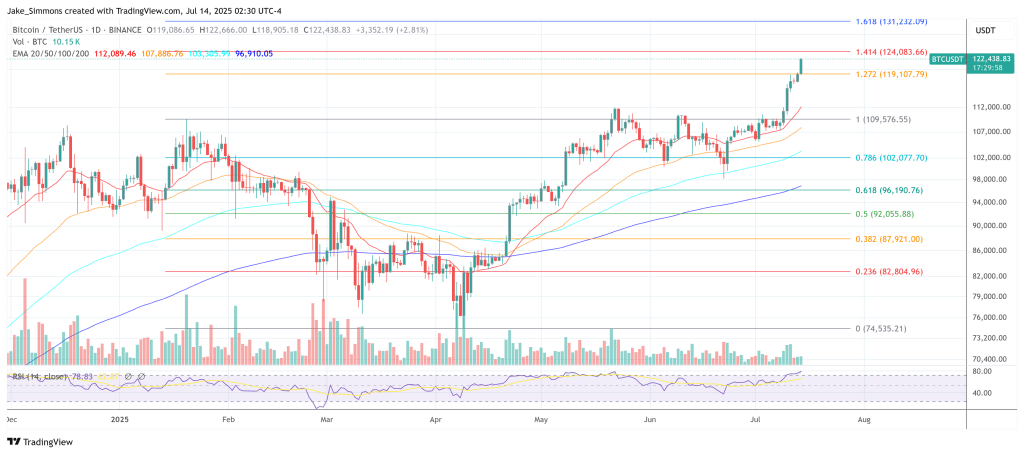
The Bitcoin Liquidity Supercycle Has Just Begun, Says Hedge Fund CEO
Bitcoin punched through a fresh record above $122,000 on the morning of 14 July, extending its month...
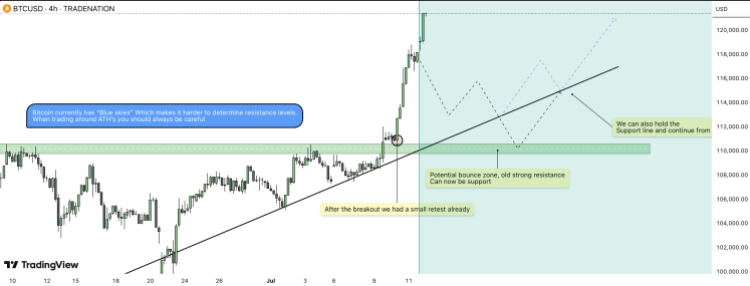
Bitcoin Price Crash Possible As Correction Sentiment Takes Hold — $110,000 Next?
After hitting a new all-time high of $121,400, the Bitcoin price has started consolidating once agai...