XRP Price Under Pressure — Can It Maintain The Bullish Structure?


XRP price started a downside correction from the $2.220 zone. The price is consolidating and might decline further toward the $2.020 support.
- XRP price started a downside correction below the $2.20 zone.
- The price is now trading below $2.150 and the 100-hourly Simple Moving Average.
- There was a break below a bullish trend line with support at $2.150 on the hourly chart of the XRP/USD pair (data source from Kraken).
- The pair could find bids near the $2.020 zone and start a fresh increase.
XRP Price Dips Below Support
XRP price attempted more gains above the $2.150 zone, like Bitcoin and Ethereum . The price spiked above the $2.20 and $2.220 levels, but the bulls failed to extend gains.
A high was formed at $2.2294 and the price is now correcting gains. There was a move below the $2.20 and $2.15 levels. The price dipped below the 23.6% Fib retracement level of the upward move from the $1.910 swing low to the $2.2294 high.
Besides, there was a break below a bullish trend line with support at $2.150 on the hourly chart of the XRP/USD pair. The price is now trading below $2.180 and the 100-hourly Simple Moving Average.
On the upside, the price might face resistance near the $2.150 level. The first major resistance is near the $2.20 level. The next resistance is $2.220. A clear move above the $2.220 resistance might send the price toward the $2.320 resistance.
Any more gains might send the price toward the $2.40 resistance or even $2.450 in the near term. The next major hurdle for the bulls might be $2.50.
More Losses?
If XRP fails to clear the $2.20 resistance zone, it could start another decline. Initial support on the downside is near the $2.070 level or the 50% Fib retracement level of the upward move from the $1.910 swing low to the $2.2294 high. The next major support is near the $2.020 level.
If there is a downside break and a close below the $2.020 level, the price might continue to decline toward the $2.00 support. The next major support sits near the $1.920 zone.
Technical Indicators
Hourly MACD – The MACD for XRP/USD is now gaining pace in the bearish zone.
Hourly RSI (Relative Strength Index) – The RSI for XRP/USD is now below the 50 level.
Major Support Levels – $2.070 and $2.020.
Major Resistance Levels – $2.20 and $2.220.
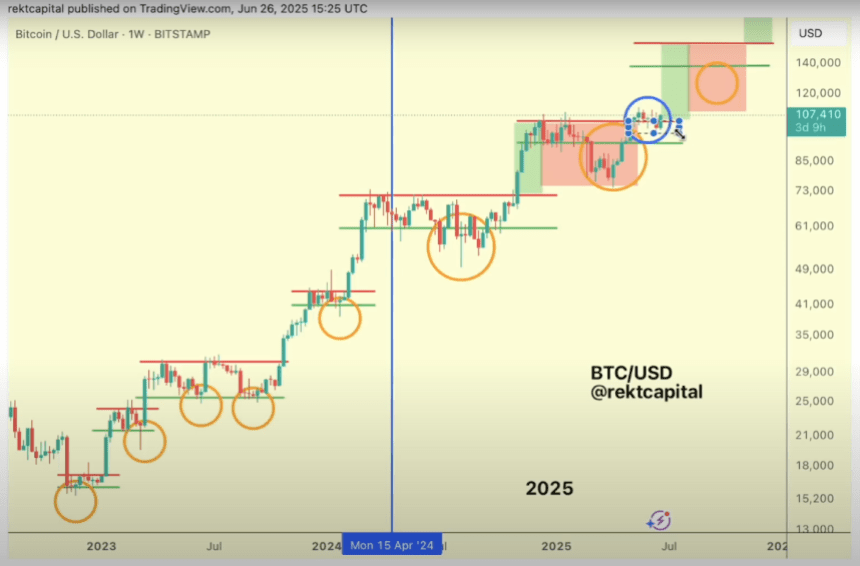
Bitcoin Next Price Discovery Coming? Analyst Shares BTC’s 2025 Roadmap
This week, Bitcoin (BTC) has recovered from its recent drop below the $100,000 level and is attempti...
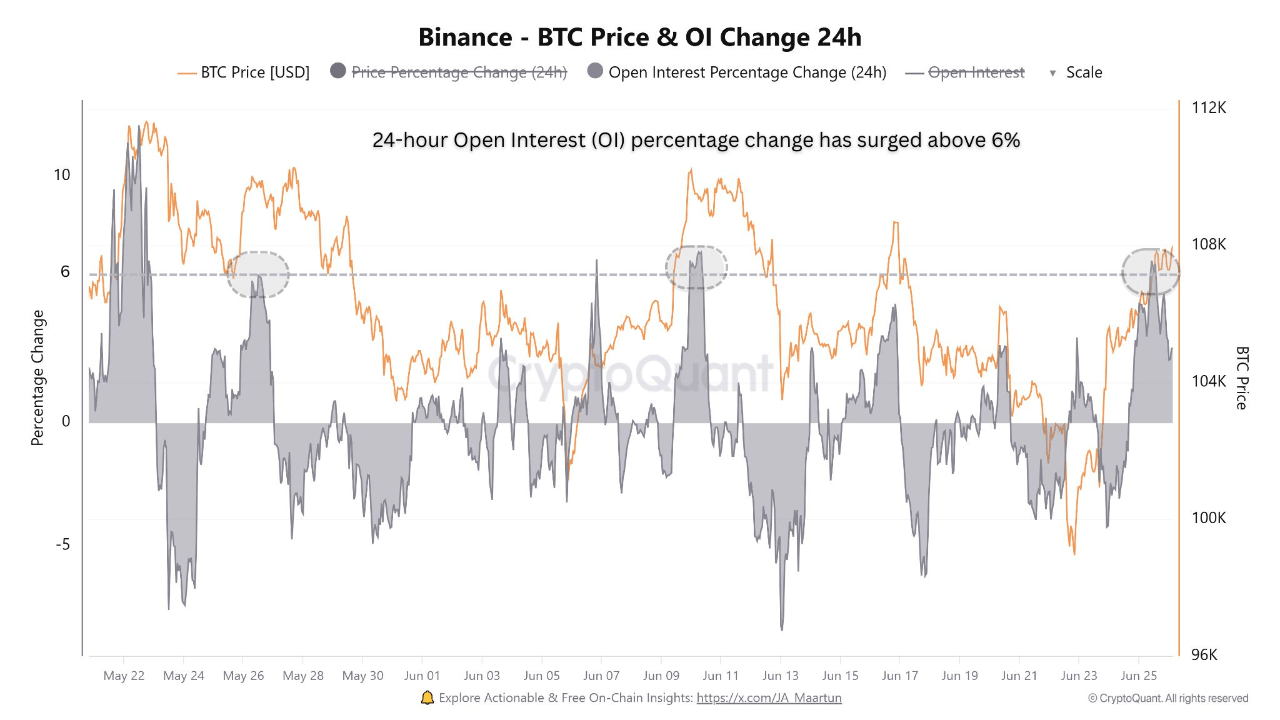
Bitcoin Binance Open Interest Shoots Up: Warning For BTC?
Data shows the Bitcoin Open Interest on the cryptocurrency exchange Binance has recently shot up. Wh...
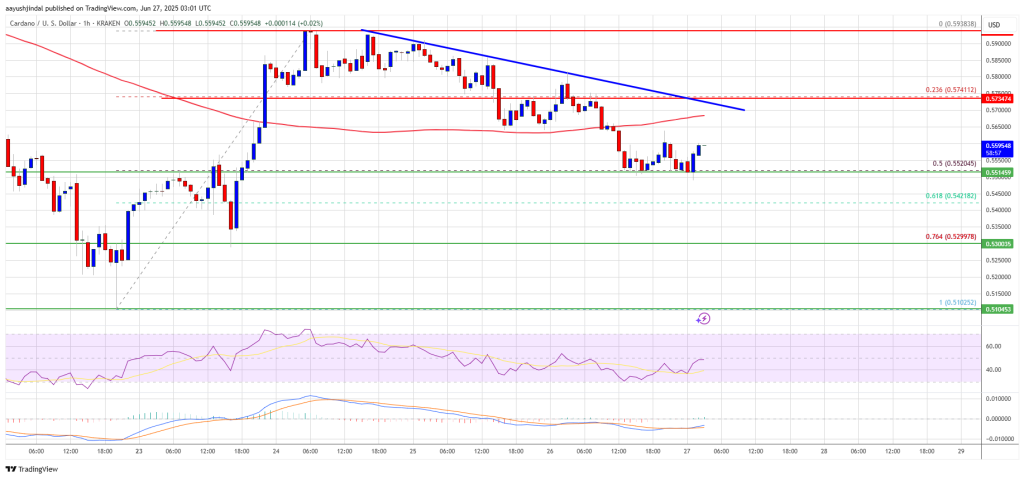
Cardano (ADA) Bears Active — Token at Risk of Another Leg Down
Cardano price started a fresh decline below the $0.5750 zone. ADA is now consolidating and might str...