Bitcoin Network Activity Index Nears Four-Year Low Amid Reduced On-Chain Engagement


- Bitcoin’s Network Activity Index nears four-year low despite steady price levels.
- Historical lows in network activity often precede price rebounds or accumulation phases.
- Declines in addresses, transactions, UTxOs, and block size signal reduced network engagement.
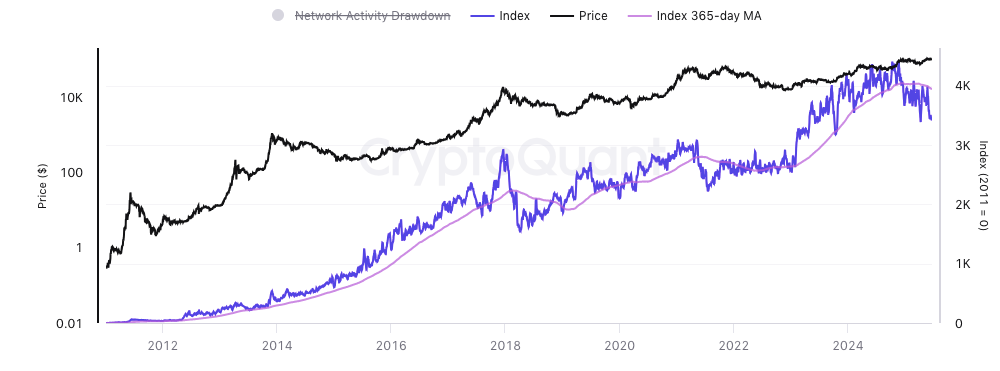
The CryptoQuant Network Activity Index, a major measure of Bitcoin ’s on-chain health, is approaching levels not seen in nearly four years. This index displays various major network indicators, including active addresses, transaction counts, total UTxOs (unspent transaction outputs), and average block size in bytes. The recent decline points to a slowdown in network usage despite Bitcoin’s relatively steady price, raising attention among analysts monitoring the cryptocurrency’s fundamental activity.
The CryptoQuant Network Activity Index has historically tracked closely with Bitcoin’s price movements. Since early 2020, the index has shown volatile patterns, often rising alongside price rallies and falling during market corrections. Currently, the index has fallen below the 2,400 mark, nearing a four-year low, as shown in the Network Activity Drawdown metrics. This decline contrasts with Bitcoin’s price, which remains relatively elevated, highlighting a divergence between network engagement and market valuation.
Historical Context of Network Activity Trends
After reviewing data from 2011 to mid-2025, we found that the Network Activity Index displays steady growth in network engagement that is aligned with Bitcoin’s long-term price appreciation. Major drops in network activity have coincided with large bear markets, including the 2018 crash and the 2022 downturn. Each prior period of low activity was followed by a recovery in the index, often preceding price rebounds or phases of accumulation.
During Bitcoin’s rallies in 2023 and early 2024, the index reached all-time highs, reflecting increased transactional volume and user participation. However, starting in late 2024, the index has declined below its 365-day moving average, suggesting a reduction in network usage even as price levels remained comparatively stable.
Indicators and Implications of the Current Activity Drop
The CryptoQuant Network Activity Index aggregates multiple factors to gauge Bitcoin’s transactional health. The current low readings result from decreases in active addresses, transaction counts, total UTxOs, and average block size. Together, these elements point to subdued network engagement.

The ongoing deterioration may mean that activities have stalled on the network or participation has changed significantly. According to analysts, past bottoms in the network activity would show consolidating the periods in the market thus indicating a possibility of accumulation before price would move.
Overall, the Network Activity Index can still be used as a useful metric to monitor the fundamental health of the Bitcoin network and could provide a timely signal to a shift in market sentiment based on how on-chain indicators perform.

Chainlink ($LINK) Surges by 13% After Mastercard Deal
Chainlink ($LINK) surges 13% after Mastercard partnership, competing Bitcoin ($BTC) as crypto adopti...

Investors Favor Little Pepe (LILPEPE) for the Next Crypto Bull Run—Why It’s a Smarter Bet Than Solana (SOL) Was at $0.50
Little Pepe (LILPEPE) blends meme power with Layer-2 utility—making it a smarter, earlier bet than S...

Mastercard and Chainlink Enable Direct Crypto Purchases via Swapper Finance
Mastercard, Chainlink, and Swapper Finance launch a new platform that lets billions of users buy cry...

