Why The June 22 Date Is Important As Bitcoin Price Flirts With $100,000


The Bitcoin price action is currently testing investors’ nerves as it hovers around $100,000. While it flirts with this psychological level , analysts are highlighting June 22, 2025, as a key date for potential volatility. Backed by both historical volatility patterns and technical indicators, this date is gearing up to be a critical window for Bitcoin’s next move.
Bitcoin Price Braces For Volatility On June 22
Bitcoin is entering a decisive phase as it trades above the $100,000 mark, with technical signals identified by TradingView expert ‘readCrypto’ aligning around a critical time frame—-June 22. The chart analysis shows that June 22 is an important date, signaling the projected start of Bitcoin’s next volatility window , with a potential to break out or break down depending on how the flagship cryptocurrency reacts to key support and resistance zones.
Currently, Bitcoin is trading at $104,731, close to a pivotal confluence range between $104,463 and $106,133—a zone highlighted as a structural mid-point. This area is defined by the DOM (60) and a Heikin-Ashi high point on the price chart, marking the formation of a recent upper boundary. Moreover, the lower end of the range sits around $99,705, which is the HA-High support level, where the price has previously been tested but not yet broken.
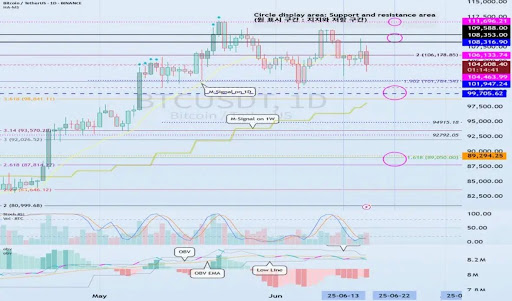
According to the analyst, the June 22 date is important because it coincides with the confluence of key price levels with the M-Signal indicator on the weekly chart. This indicator is currently rising and aligning near the $99,705 HA-high level. If Bitcoin falls below this level, it could signal the start of a deeper corrective move , possibly toward the monthly M-Signal line or even the $89,294 region, corresponding with the 2.618 Fibonacci.
Conversely, if Bitcoin holds above this level and breaks out of the $108,316 resistance, momentum could shift back to the upside. The analyst has set upper bullish targets near $109,598 and $111,696, reflecting the final resistance zone before new highs.
Support Zones And Momentum Indicate Tense Standoff
Moving past readCrypto’s volatility-driven projection, the TradingView analyst’s Bitcoin chart shows that the On-Balance-Volume (OBV) oscillator remains below the zero line. This suggests that despite recent gains, selling pressure may still be dominating the broader market. However, the histogram in the chart shows signs of waning momentum on the sell side.
This divergence aligns with Bitcoin’s weakening Stochastic Relative Strength Index (RSI) , which indicates momentum may be cooling. The low OBV readings, combined with the recent bounce from a lower support range, also underscore an intense standoff within the market. If Bitcoin breaks below the Heikin Ashi high point at $99,705, a retest of new lows at $89,294 is more than likely.
Until then, readCrypto’s analysis shows that all eyes are on the $104,000 to $106,000 zone. The area between $99,705 and $108,316 now defines the high-boundary consolidation range. A confirmed move outside this range, mainly triggered during the June 21-13 window, could dictate Bitcoin’s next major move .

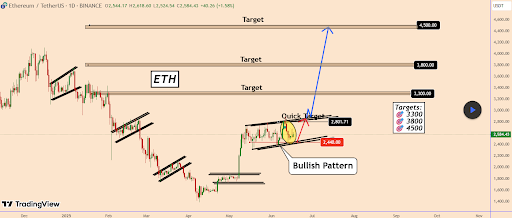
Ethereum Bullish Wave Towards ATH Coming? Here Are The Targets
Recent price action in the past 24 hours has seen Ethereum clawing back above $2,500 after a pullbac...

Big Move For XRP: Ripple-Backed ETF Launches In Canada
Canada’s Toronto Stock Exchange today saw a new entrant aimed at making XRP more accessible to inves...
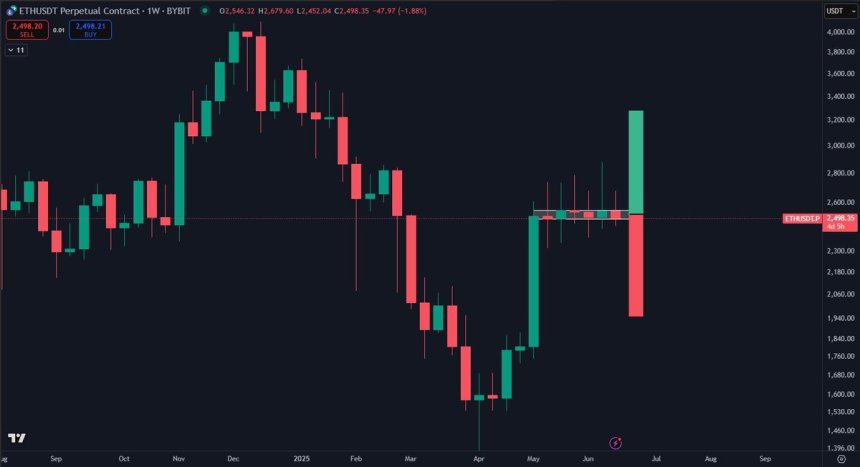
Ethereum Analyst Eyes High Timeframe Close – Range Break Above $2,800 Could Be Violent
Ethereum is currently facing a pivotal moment as it continues to consolidate below the $3,000 level....