XRP Analysts Forecast Major Price Surge as Key Resistance Faces New Test


- The dominance of XRP is attempting to break a crucial resistance level in its fifth attempt, which enhances the probability of success.
- Analysts predict that XRP can reach a price of $27 should the market cap reach $5.5 trillion.
- The technical patterns display bullish indications with a breakout of a falling wedge and a bullish flag formation.
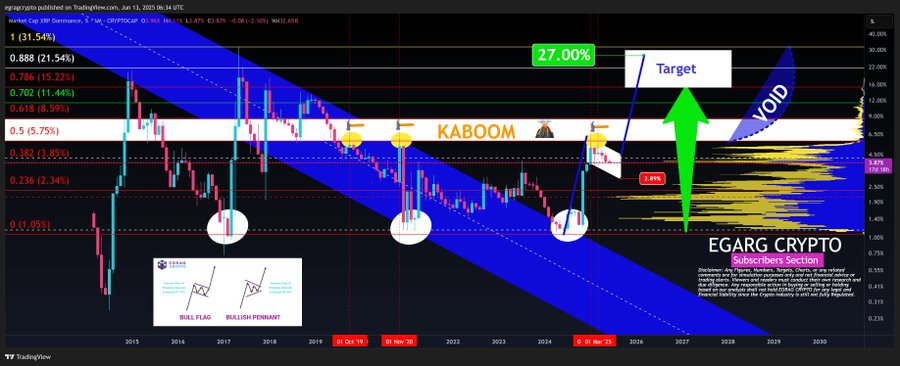
XRP has been testing another historically important resistance area, and several analysts say a breakout could be near. A chart by crypto analyst EGRAG CRYPTO shows that the 0.5 Fibonacci has been a significant obstacle in previous cycles – in October 2019, November 2020, and once more at the beginning of 2025.
This is the fifth time that XRP dominance has tapped this line. EGRAG shows that the likelihood of a breakout grows when the resistance is tested repeatedly. Should the 27% dominance target be reached, a potential XRP market cap of 1.5 trillion would represent a price level of XRP of 27, based on an overall crypto market valuation of 5.5 trillion.

Analyst Steph_is crypto includes a cycle-oriented approach using the Elliott Wave theory. His monthly chart puts XRP in Wave 3 of a five-wave pattern that has previously occurred before huge parabolic rallies. The comparison includes the past bull markets in 2017 and 2020, during which XRP exploded in Waves 3 and 5.
The existing trend shows that XRP could be about to make another impulsive rise, and Wave 5 will see the token rise above $40 by 2025. The rocket symbols and the symmetry of the waves indicate the assurance of replicating the historical behavior in the presence of similar macro conditions.
Technically, the chart of XRP also demonstrates a bullish flag pattern that has been developing throughout the years. EGRAG CRYPTO considers this to be within a macro consolidation area, and volume gaps above the existing range suggest declining resistance on the way to 27. The flag formation is in line with a larger bullish pennant formation.
Daily Chart Signals Bullish Retest After Wedge Breakout
XRP Captain provides additional evidence of the bullish sentiment on the daily chart. The daily chart illustrates XRP expanding a falling wedge formation, which is normally regarded as a bullish reversal pattern, and is now confronting a retest of the pattern at the range of $2.10 to $2.20.
Following the breakout above the declining trendline, a corrective pullback has occurred which analysts view as a good consolidation prior to resumption. This retest coincides with past areas of support and indicates a bullish continuation should buyers regain control of higher grounds. The analyst notes a Fibonacci retracement extension minimum target of $10, given momentum price action should the retest support and volume increase.
Ripple-SEC Settlement May Be Near
Ripple and the U.S. Securities and Exchange Commission (SEC) could be in the final stages of a years-long legal battle as the two recently filed a new motion together on June 12. In the filing, Judge Analisa Torres is requested to vacate a prior injunction of $125 million being held in escrow.
In the proposed settlement, 50 million would be freed to SEC, and Ripple would recover the rest (75 million). Should the agreement be approved, it would end the continued appeals and possibly seal the high-profile case.

MOCA Launches on Coinbase through Aerodrome DEX Integration, Expanding DeFi Access
The integration has made MOCA available on Aerodrome, a DEX on Base, allowing Coinbase users to dire...

Whale Wallet Receives Over $220K in BSC Tokens Amid $250K Crypto Accumulation Spree
BSC Foundation acquired $250K in Cake, LISTA, Moolah, and VIXBT within 30 mins, signaling coordinate...

SharpLink Bets Big on Ethereum with $463M Acquisition
SharpLink buys $463M in Ethereum and stakes 95% to support the network and earn yield, positioning i...

