Bitcoin Price Fails at $110K—Is the Rally Running Out of Steam?


Bitcoin price started a fresh increase above the $107,500 zone. BTC is now struggling to clear $110,500 and might correct some gains.
- Bitcoin started a fresh upward move above the $108,000 zone.
- The price is trading above $107,800 and the 100 hourly Simple moving average.
- There was a break below a bullish trend line with support at $109,450 on the hourly chart of the BTC/USD pair (data feed from Kraken).
- The pair could start a fresh surge if it clears the $110,000 resistance zone.
Bitcoin Price Corrects Gains
Bitcoin price started a fresh increase after it settled above the $105,500 support zone. BTC was able to surpass the $106,500 and $108,000 resistance levels.
The bulls even pumped the price above the $109,200 resistance. A high was formed near $110,375 and the price is now correcting gains. There was a move below the 23.6% Fib retracement level of the upward move from the $105,477 swing low to the $110,373 high.
Besides, there was a break below a bullish trend line with support at $109,450 on the hourly chart of the BTC/USD pair. Bitcoin is now trading above $107,500 and the 100 hourly Simple moving average .
On the upside, immediate resistance is near the $109,250 level. The first key resistance is near the $110,000 level. The next key resistance could be $110,500. A close above the $110,500 resistance might send the price further higher. In the stated case, the price could rise and test the $112,000 resistance level. Any more gains might send the price toward the $115,000 level.
More Losses In BTC?
If Bitcoin fails to rise above the $110,000 resistance zone, it could start another decline. Immediate support is near the $108,000 level and the 50% Fib retracement level of the upward move from the $105,477 swing low to the $110,373 high. The first major support is near the $107,350 level.
The next support is now near the $106,550 zone. Any more losses might send the price toward the $105,500 support in the near term. The main support sits at $105,000, below which BTC might gain bearish momentum.
Technical indicators:
Hourly MACD – The MACD is now losing pace in the bullish zone.
Hourly RSI (Relative Strength Index) – The RSI for BTC/USD is now below the 50 level.
Major Support Levels – $108,000, followed by $107,350.
Major Resistance Levels – $110,000 and $110,500.
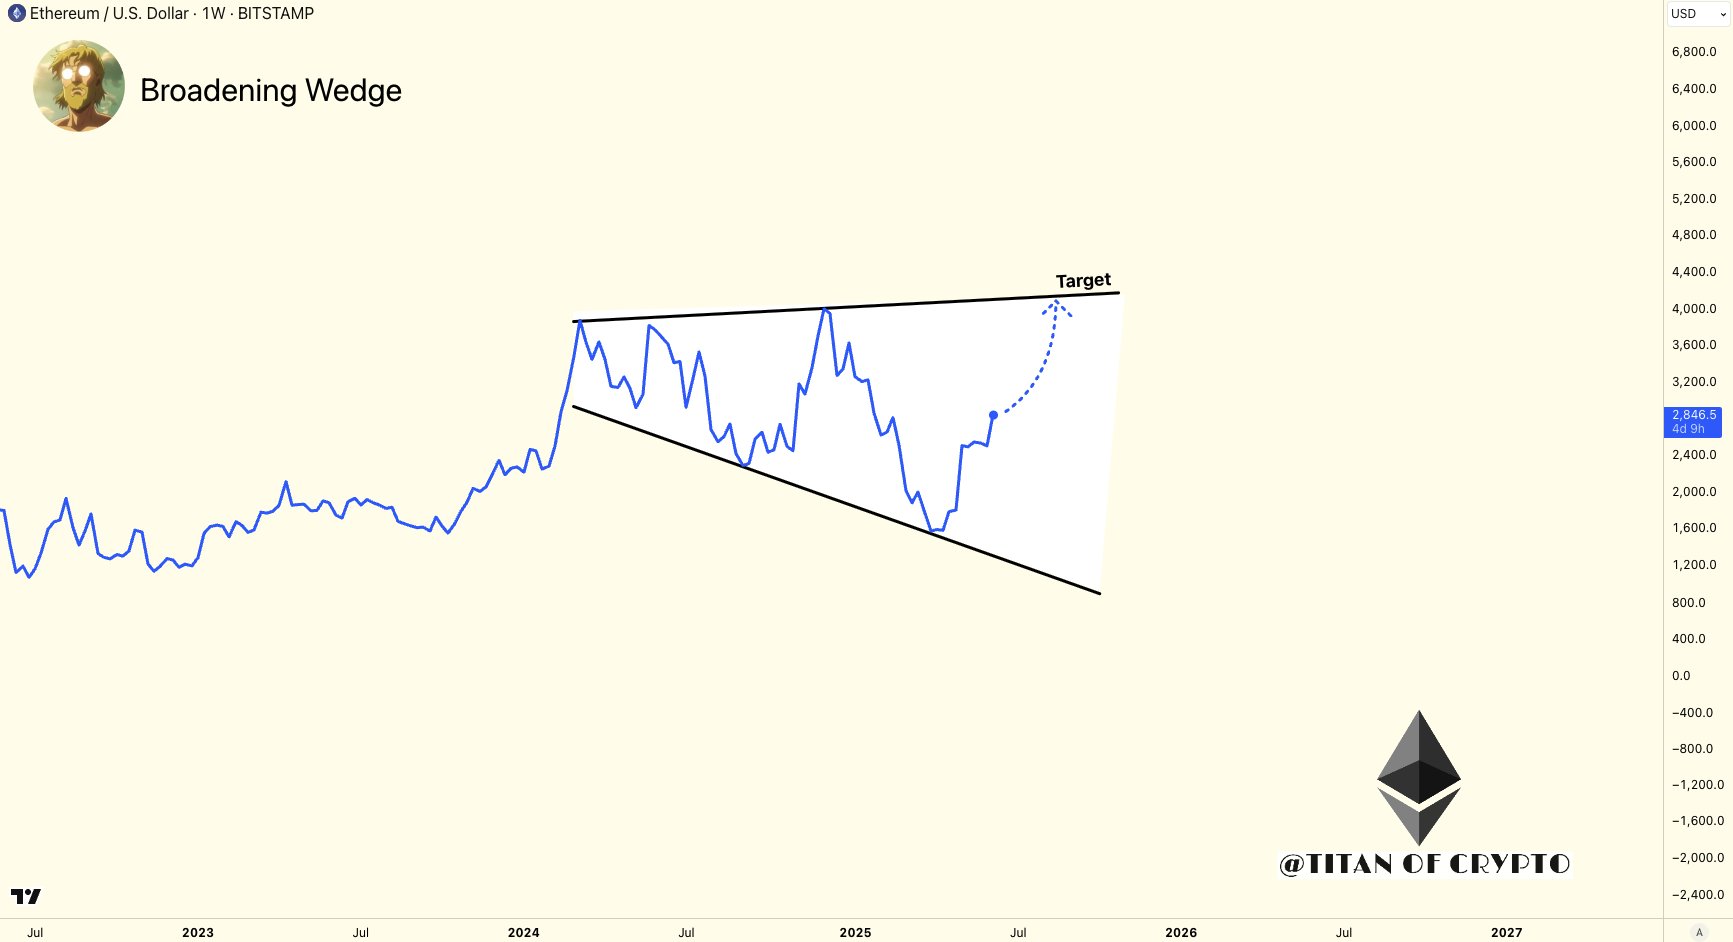
Ethereum Breakout Imminent? Broadening Wedge Hints At $4,200 Surge
According to recent technical analysis, Ethereum (ETH) may be gearing up for a major breakout that c...
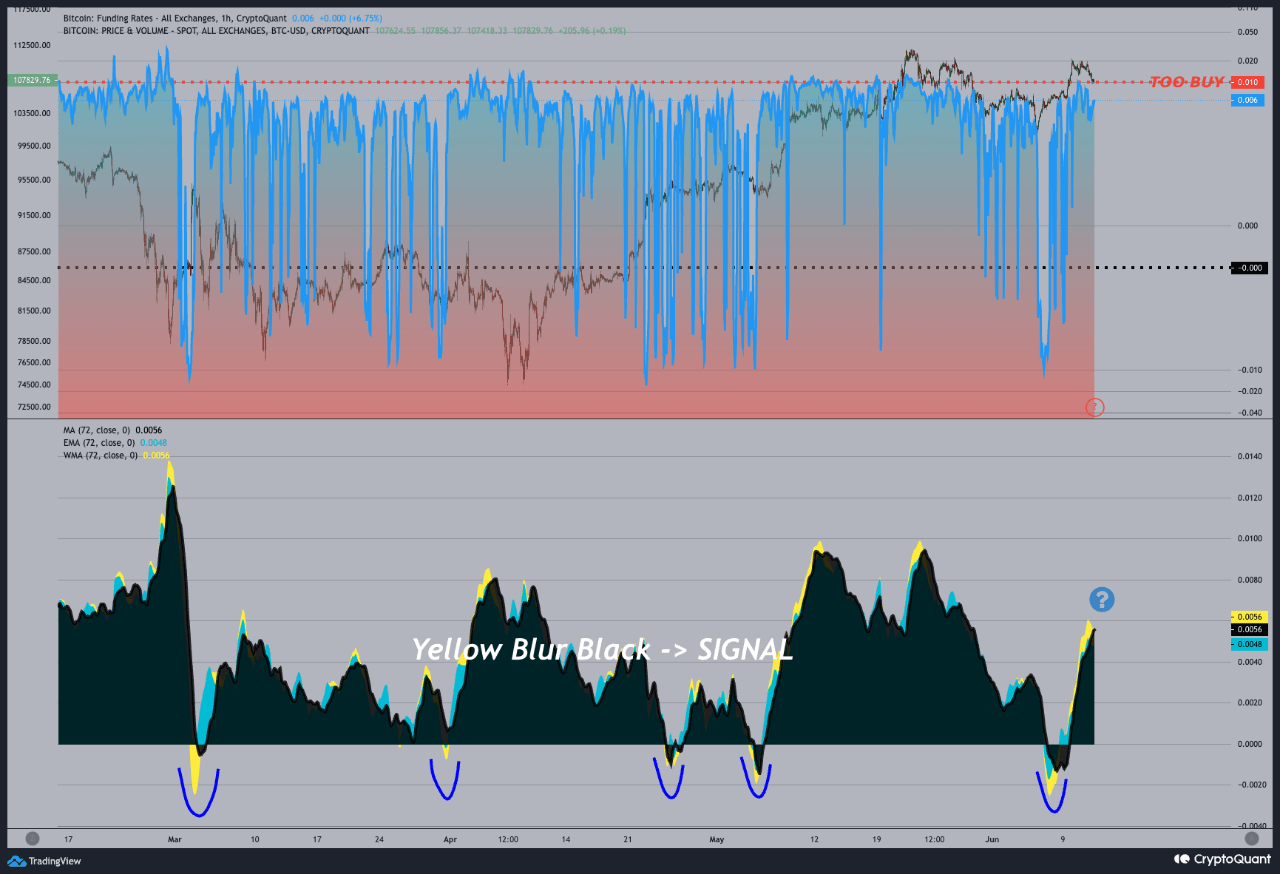
Bitcoin Funding Rate Flips Again And History Says A Rally Is Around The Corner
Bitcoin’s price has declined slightly following recent gains, falling 2.3% over the past 24 hours to...
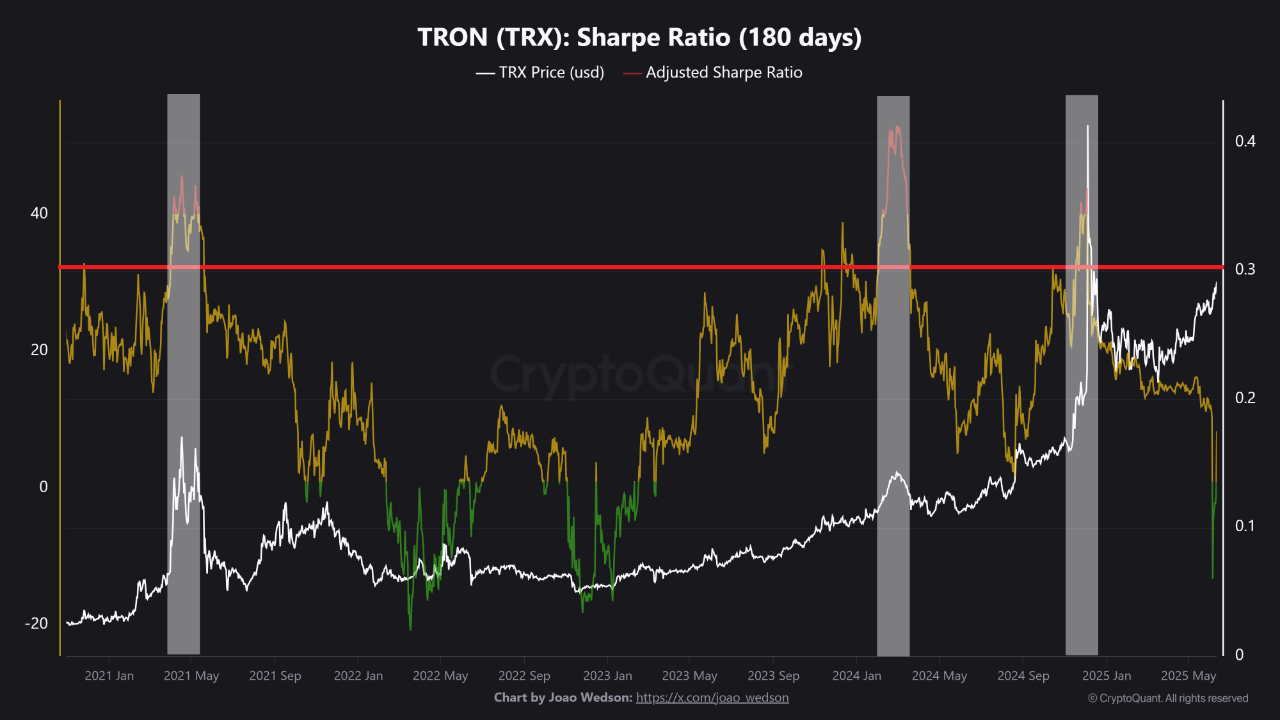
Tron Has Plenty Of Room For A 2025 Bull Run, Risk Metric Signals
The Tron (TRX) Sharpe Ratio suggests the cryptocurrency’s price may be far from overheating, a sign ...