SAND Price Breakout: Is The Sandbox Gearing Up for a Major Rally?


The post SAND Price Breakout: Is The Sandbox Gearing Up for a Major Rally? appeared first on Coinpedia Fintech News
In a major event, GameStop has recently acquired 4,710 Bitcoins worth over $516 million and also launched a Bitcoin-focused ETF, sending waves across the broader crypto market. This bullish sentiment has spilled into the metaverse and gaming token segments, with The Sandbox (SAND price) leading the charge.
Currently, SAND has secured a place on CoinMarketCap’s top trending coins list, sparking curiosity among investors. Its recent price spike has caught the attention of traders, raising questions like: Is SAND ready for a breakout?
SAND Price Analysis: Bullish Momentum or Mirage?
The SAND token is trading at $0.2980, reflecting a 2.26% gain over the last 24 hours and a 4.29% rise over the past week. The token’s market cap stands at $756.66 million, with trading volume surging nearly 30% to $76.2 million. The 24-hour range between $0.2887 and $0.3027 shows growing bullish sentiment.
On the daily chart, SAND has broken above its 9-day SMA at $0.2810, a key short-term bullish indicator. The RSI has moved to 52.55, pushing past the neutral zone and signaling growing buying pressure. A bullish flag pattern is taking shape, often seen as a continuation signal.
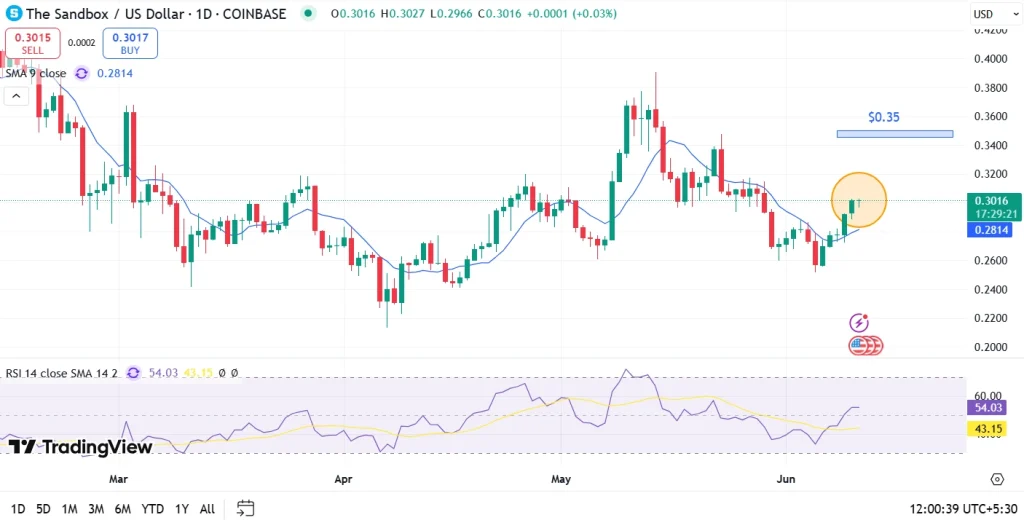
A sustained move above the $0.30–$0.35 resistance range could open the gates for a stronger rally, potentially targeting higher psychological levels. However, traders should remain cautious, as a key support lies at $0.2568, with further downside risk toward $0.21 if momentum fails.
Read our The Sandbox (SAND) Price Prediction 2025, 2026-2030 for long-term targets!
FAQs
As of now, SAND crypto is trading at $0.2980, up 2.26% over the past 24 hours.
Yes, the token has broken above its 9-day SMA and shows strong RSI and MACD indicators, pointing to bullish momentum.
Support lies at $0.2568 and $0.21. A break above $0.35 could confirm a bullish continuation.

Bitcoin Pepe Is the Best Crypto to Buy Now Before Tier 1 CEX Listing Hits
The post Bitcoin Pepe Is the Best Crypto to Buy Now Before Tier 1 CEX Listing Hits appeared first on...
Best Crypto Meme Presale Coins to Unlock Big Gains
The post Best Crypto Meme Presale Coins to Unlock Big Gains appeared first on Coinpedia Fintech News...
Will XRP Price Hit a New All-Time High Before June 17?
The post Will XRP Price Hit a New All-Time High Before June 17? appeared first on Coinpedia Fintech ...