Bitcoin Price Bounces Past 105K: Is a Full-Blown Rally Back on the Cards?


Bitcoin price started a recovery wave above the $105,000 zone. BTC is now consolidating and might attempt to clear the $106,500 resistance.
- Bitcoin started a recovery wave above the $105,000 zone.
- The price is trading above $105,000 and the 100 hourly Simple moving average.
- There is a bullish trend line forming with support at $105,350 on the hourly chart of the BTC/USD pair (data feed from Kraken).
- The pair could start a fresh decline if it breaks the $104,000 support zone.
Bitcoin Price Restarts Increase
Bitcoin price started a fresh decline and traded below the $102,500 support zone. BTC even traded close to the $100,000 zone before the bulls appeared.
A low was formed and the price recovered above the $103,500 resistance . The bulls even pushed the price above the $105,000 resistance. A high was formed at $106,426 and the price is now consolidating gains above the 23.6% Fib retracement level of the upward move from the $100,400 swing low to the $106,426 high.
Bitcoin is now trading above $105,000 and the 100 hourly Simple moving average . There is also a bullish trend line forming with support at $105,350 on the hourly chart of the BTC/USD pair.
On the upside, immediate resistance is near the $106,200 level. The first key resistance is near the $106,500 level. The next key resistance could be $107,600. A close above the $107,600 resistance might send the price further higher. In the stated case, the price could rise and test the $108,800 resistance level. Any more gains might send the price toward the $110,000 level.
Another Decline In BTC?
If Bitcoin fails to rise above the $106,200 resistance zone, it could start another decline. Immediate support is near the $105,200 level and the trend line. The first major support is near the $103,500 level and the 50% Fib retracement level of the upward move from the $100,400 swing low to the $106,426 high.
The next support is now near the $102,000 zone. Any more losses might send the price toward the $100,500 support in the near term. The main support sits at $100,000, below which BTC might gain bearish momentum.
Technical indicators:
Hourly MACD – The MACD is now gaining pace in the bullish zone.
Hourly RSI (Relative Strength Index) – The RSI for BTC/USD is now above the 50 level.
Major Support Levels – $105,200, followed by $103,500.
Major Resistance Levels – $106,200 and $107,600.
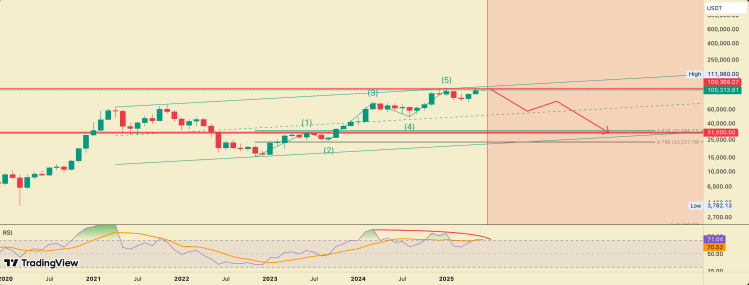
Bitcoin Price Risks Crash To $31,000 Amid 5-Wave Impulse Completion
Over the last few weeks, the Bitcoin price has been on an upward trajectory, propelled forward mainl...

Blank Pi Network Wallets Spark Outcry—What’s The Network Hiding?
Pi Network members are becoming increasingly agitated after they found zero balances of their tokens...
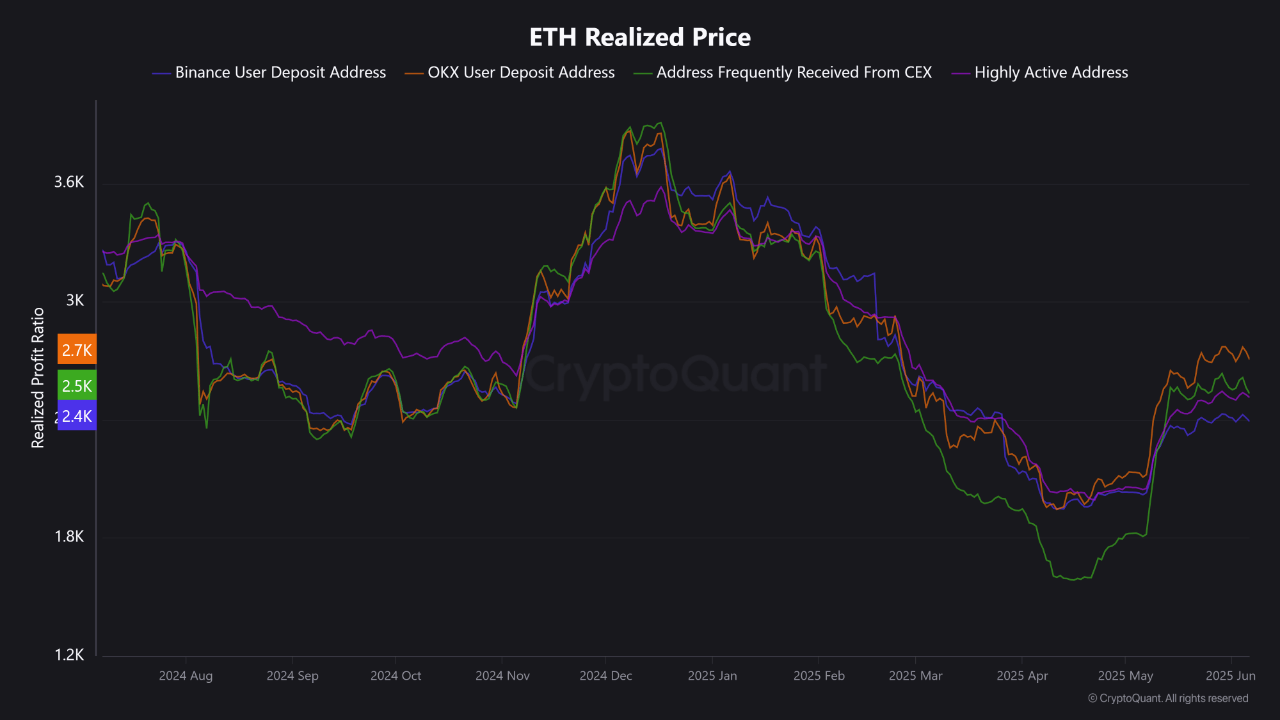
Ethereum Price Performance Could Hinge On This Binance Metric — Here’s Why
Over the past few weeks, the Ethereum price has struggled to maintain its bullish momentum from earl...