Solana Reclaims $141 Support as Whale Moves Spark Market Momentum


- A whale has unstaked 175,062 SOL in the past two months and transferred most of it to Binance.
- SOL reclaimed the $141.19 demand zone and is now at the $149 level with bullish momentum.
- Wave analysis reveals the possible move higher to a new all-time high of $152 breaks convincingly.
Major on-chain activity has brought Solana ($SOL) back into focus after it was revealed that a long-term holder has been unstaking and transferring millions in SOL on Binance over the past two months. Onchain Lens data shows a whale unstaked 50,017 SOL worth $7.52 million on Jun. 8 and 50,000 SOL to Binance. The transfer was followed by the same amount the day before, 25,008 SOL, totaling $3.7 million.
Since April, the whale has unstaked 175,062 SOL, an equivalent of $25.16 million. The SOL had been staked for four years to concede that the repositioning was a strategic decision. While these transfers take place, the whale still retains 1,126,767 SOL, which is $168.44 million, in staking.
While the repeated unstaking and transfers to Binance have thus far not led to notable selling, traders are ready to react to upcoming staking developments that could create short-term price action. This could mean that the whale is instead slowly divesting rather than making an outright exit.
Price Holding Key Levels as Bulls Aim for Breakout
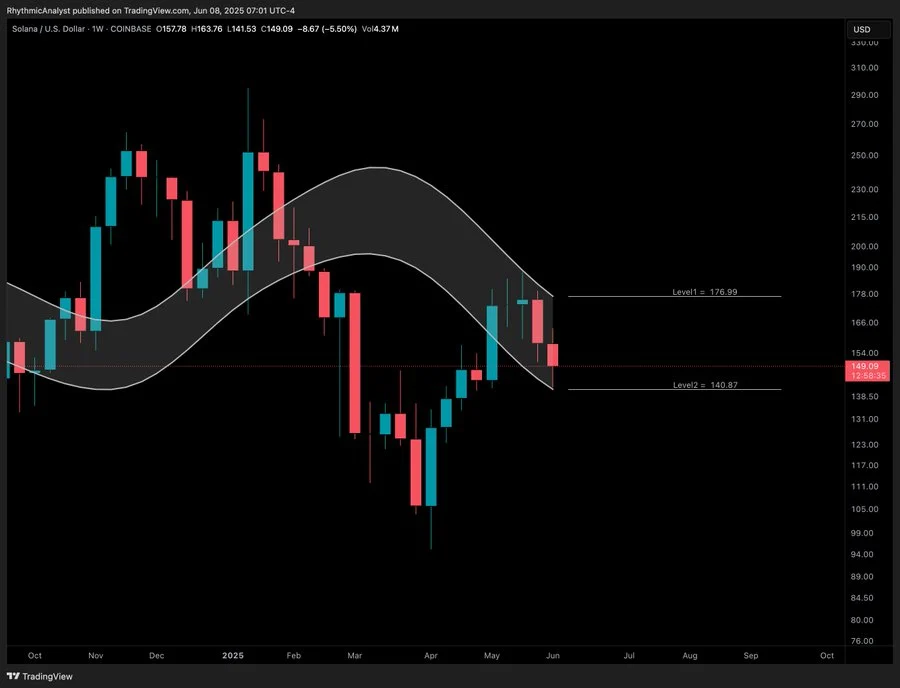
In the weekly timeframe, SOL hovers at $149, down-trending between critical levels, with resistance at $176.99 and support at $140.87. Technical analysts regard this zone as neutral but full of breakout potential. However, a move above $176 could lift the price steeply, whereas a slip below $140 would invalidate the bullish structure.

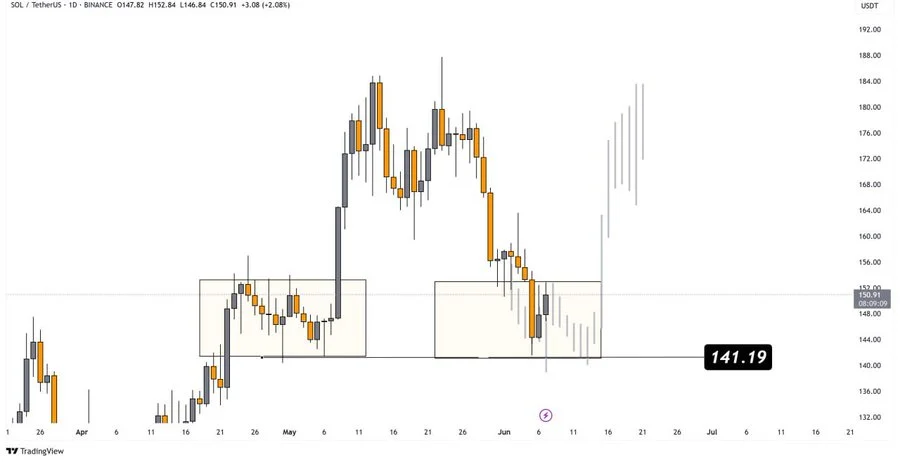
On the daily chart, things are clearer. SOL has reclaimed its key demand zone at $141.19, where it has formed a double bottom, indicating a potential recovery strength. According to price action, it now looks like it is forming a V-shaped reversal pattern. If a break above $152 continues, test momentum buying may be set for a retest of $176 and beyond.

The structure is bullish, while the short-term bias remains bullish, invalidation is likely below $141.19. Bulls are closely watched to see if they can keep control over this level through mid-June.
Wave Pattern Analysis Signals Potential Move Toward All-Time High
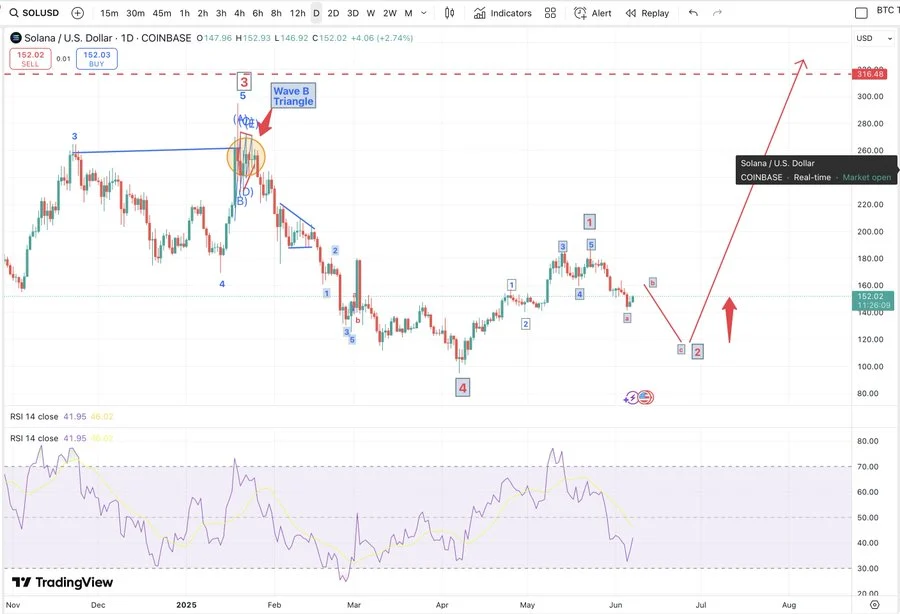
According to Elliott Wave projections, Solana may have concluded a protracted wave 4 correction. The current market setup seems to be in the early stages of a bigger wave 5 cycle. If this is valid, SOL could be pushed back to or beyond its previous all-time high with a series of upward-facing waves.

The wave structures on the 1D chart support this theory and have current price action inside wave 2 of a final bullish push. A bounce from the $140–$150 zone could mark wave 3 of 5 of this pattern, which is the strongest, or most impulsive, phase in this type of pattern. RSI readings also reside close to neutral readings thus opening up a possibility for higher prices.
However, it seems that macroeconomic conditions, along with whale activity, have the potential to change momentum, yet technical indicators stand with the recovery narrative. A breakout above near-term resistance would confirm the bullish setup for the weeks ahead.

Crypto Top Gainers of the Week: ICP, INJ, SPX Lead the Charge & Other 10 Best-Performers
The list highlighted the top crypto assets that printed massive growth over the week, led by Interne...

Presale Countdown Begins? Arctic Pablo’s lcicle Heights Rockets Past $2.69M as Baby Doge Coin and Cheems Surge Ahead
Explore the latest Arctic Pablo Coin, Baby Doge Coin, and Cheems updates. Arctic Pablo is among the ...

CryptoPunk #9723 Leads Weekly NFT Sales with $206K Transaction
CryptoPunks dominate NFT sales this week with top transaction hitting $206K as ETH trades above $2,4...

