Bitcoin RSI Dips Below 30—Is A New All-Time High Next?


Data shows the 14-day Bitcoin Relative Strength Index (RSI) has dropped into the oversold region. Here’s what this could mean for the asset.
Bitcoin RSI Has Breached Below The 30 Mark
In a new post on X, analyst Axel Adler Jr has talked about the latest trend in the RSI of Bitcoin. The “ RSI ” refers to an indicator from technical analysis (TA) that measures the speed and magnitude of changes occurring in any given asset’s price over a specific period. In the current case, the period is 14 days.
This metric is generally used for spotting oversold or overbought conditions for the asset. When the RSI is greater than 70, it can be a sign that the price is heating up and may be due a correction to the downside. On the other hand, it being under 30 can imply the asset is becoming underbought.
Now, here is the chart shared by the analyst that shows the trend in the 14-day Bitcoin RSI over the last couple of years:

As displayed in the above graph, the 14-day Bitcoin RSI has plummeted recently and is now below the 30 threshold. This naturally suggests the cryptocurrency is becoming oversold, at least from the perspective of this indicator.
“Other metrics are also showing alerts,” notes Adler Jr. “I think now all conditions are in place to start testing the ATH.” Though, while bullish developments may have occurred on the RSI and other indicators, BTC has actually declined during the past day.
On-chain data may provide hints about where the next potential support zone could be located for the asset. As the analytics firm Glassnode has revealed in its latest weekly report, the average cost basis of the short-term holders is located at $97,100.

The short-term holders (STHs) refer to the Bitcoin investors who purchased their coins during the past 155 days. The cost basis of this group has often been a relevant level for the cryptocurrency, taking turns as support and resistance.
In the chart, the analytics firm has also shown two other levels: the +1 and -1 standard deviation bands. Currently, the latter is situated at $83,200, so it’s possible that if BTC’s bearish momentum lasts for long enough to push it under the STH cost basis, this value could prove significant.
However, before this level, there is another on-chain level that could be important.

The level in question is part of the Spent Supply Distribution (SSD) Quantiles model, which basically tells us which price levels the investors selling their coins right now initially purchased them.
The 0.85 quantile is located at $95,600, which is quite close to the STH cost basis, so a retest of the zone could be a particularly vital one for Bitcoin.
BTC Price
At the time of writing, Bitcoin is floating around $101,000, down almost 5% in the last seven days.

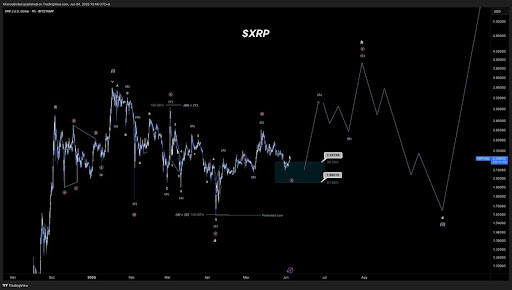
XRP Wave Structure Predicts Wild Fluctuations On Its Way To $4 ATH
The XRP price action is drawing significant attention, as analysts highlight a distinct wave structu...
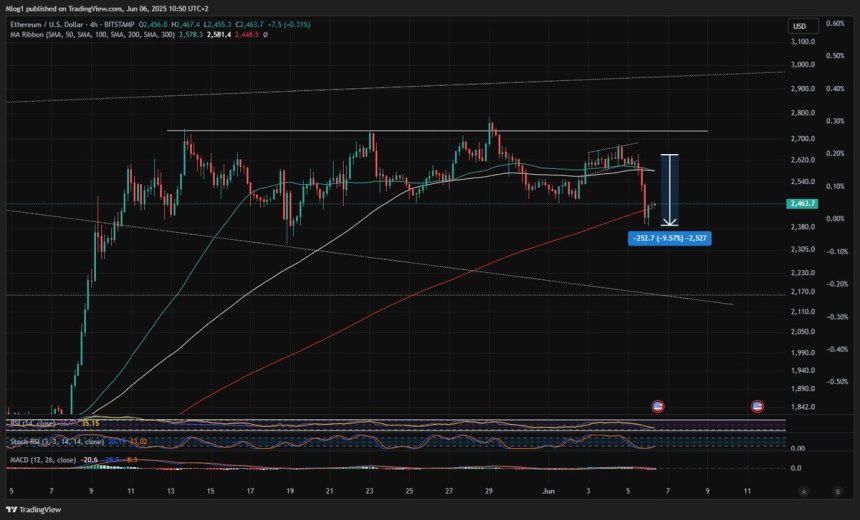
Ethereum Stabilizes After Market Drop – Key MA Reclaim Could Trigger A June Rally
Ethereum has experienced a sharp pullback, retracing over 10% since yesterday as the broader crypto ...
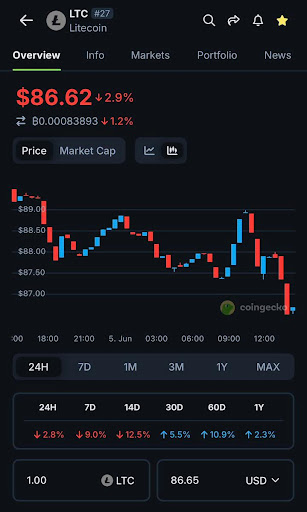
Litecoin Wobbles Under Pressure: Can It Find Footing Below $87?
Grayhoood, a crypto trader, said on X that Litecoin is currently experiencing a bearish trend, empha...