Dogecoin (DOGE) Consolidates Losses — Can Meme Coin Mania Make a Comeback?


Dogecoin started a fresh decline from the $0.2250 zone against the US Dollar. DOGE is now consolidating losses and might recover if it clears $0.20.
- DOGE price started a fresh decline below the $0.220 and $0.20 levels.
- The price is trading below the $0.20 level and the 100-hourly simple moving average.
- There is a connecting bullish trend line forming with support at $0.1910 on the hourly chart of the DOGE/USD pair (data source from Kraken).
- The price could start a fresh increase if it clears the $0.20 resistance zone.
Dogecoin Price Holds Support
Dogecoin price started a fresh decline after it failed to clear the $0.2450 zone, unlike Bitcoin and Ethereum . DOGE declined below the $0.220 and $0.20 levels.
The bears even pushed the price below the $0.1920 level. A low was formed at $0.1855 and the price is now consolidating losses. There was a minor increase above the 23.6% Fib retracement level of the downward move from the $0.2279 swing high to the $0.1855 low.
Dogecoin price is now trading below the $0.20 level and the 100-hourly simple moving average. There is also a connecting bullish trend line forming with support at $0.1910 on the hourly chart of the DOGE/USD pair.
Immediate resistance on the upside is near the $0.20 level. The first major resistance for the bulls could be near the $0.2060 level. It is close to the 50% Fib retracement level of the downward move from the $0.2279 swing high to the $0.1855 low.
The next major resistance is near the $0.2120 level. A close above the $0.2120 resistance might send the price toward the $0.2250 resistance. Any more gains might send the price toward the $0.2340 level. The next major stop for the bulls might be $0.250.
More Losses In DOGE?
If DOGE’s price fails to climb above the $0.20 level, it could start another decline. Initial support on the downside is near the $0.1910 level and the trend line. The next major support is near the $0.1850 level.
The main support sits at $0.1720. If there is a downside break below the $0.1720 support, the price could decline further. In the stated case, the price might decline toward the $0.1650 level or even $0.1550 in the near term.
Technical Indicators
Hourly MACD – The MACD for DOGE/USD is now losing momentum in the bearish zone.
Hourly RSI (Relative Strength Index) – The RSI for DOGE/USD is now above the 50 level.
Major Support Levels – $0.1910 and $0.1855.
Major Resistance Levels – $0.2000 and $0.2060.
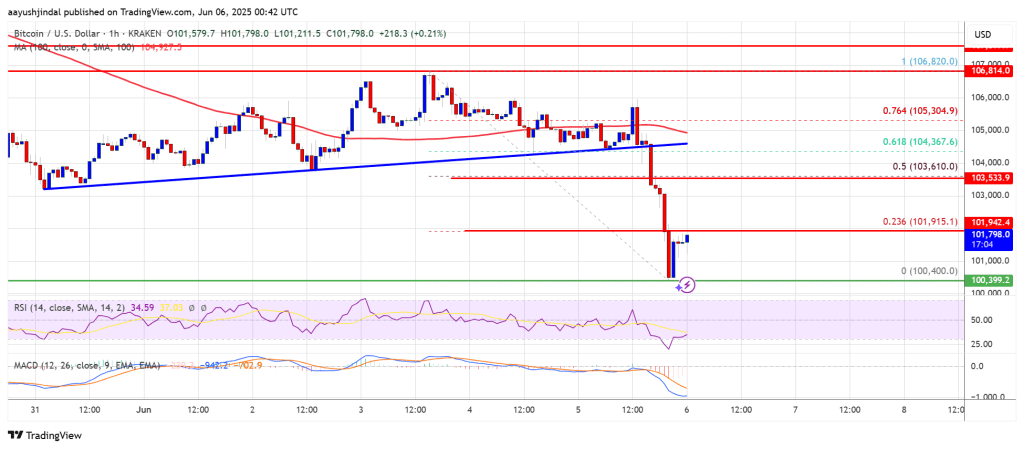
Bitcoin Price Dips Sharply Below $102K as Profit-Taking Accelerates
Bitcoin price started a fresh decline and tested the $100,500 zone. BTC is now consolidating and mig...

From Wall Street To Red Square: Moscow Exchange Lists BlackRock Bitcoin Futures
Russia’s main exchange. the Moscow Exchange, has started offering Bitcoin futures contracts. This is...
What Happens To The XRP Price If The 2017 Fractal Plays Out Again?
XRP’s price action is currently exhibiting a back-and-forth pattern around $2.20, but an interesting...