XRP Price at Risk of More Losses — Can Key Support Hold?


XRP price started a fresh decline below the $2.220 zone. The price is now correcting losses and might aim for a move above the $2.20 resistance.
- XRP price started a fresh decline below the $2.220 zone.
- The price is now trading below $2.20 and the 100-hourly Simple Moving Average.
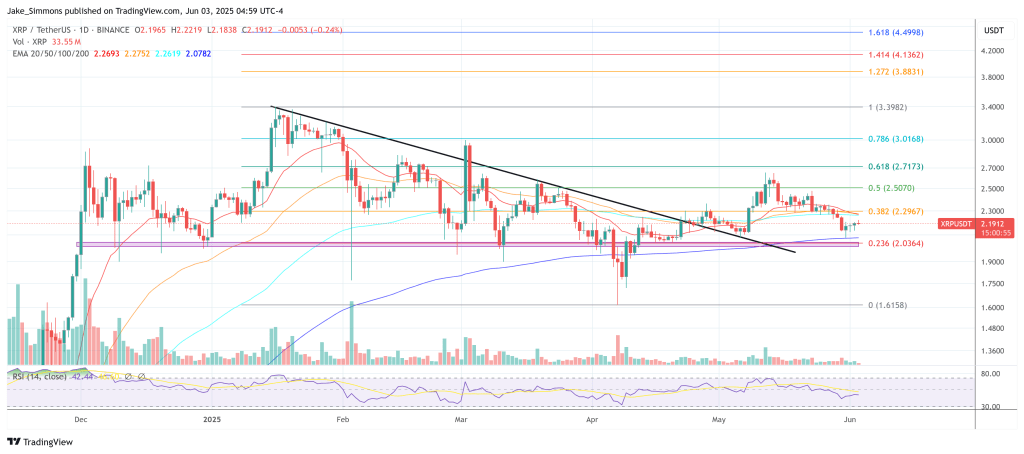
- There is a key bearish trend line forming with resistance at $2.2180 on the hourly chart of the XRP/USD pair (data source from Kraken).
- The pair might start another decline if it fails to clear the $2.220 level.
XRP Price Dips Again
XRP price failed to clear the $0.3250 resistance and started a fresh decline, like Bitcoin and Ethereum . There was a move below the $0.2800 and $0.2620 support levels.
The price even dipped below the $0.20 support level. A low was formed at $0.2081 and the price is now consolidating losses. There was a minor move above the $0.2120 level. The price cleared the 23.6% Fib retracement level of the downward wave from the $2.3540 swing high to the $2.2081 low.
The price is now trading below $2.220 and the 100-hourly Simple Moving Average. On the upside, the price might face resistance near the $2.20 level. The first major resistance is near the $2.220 level. There is also a key bearish trend line forming with resistance at $2.2180 on the hourly chart of the XRP/USD pair. It is near the 50% Fib retracement level of the downward wave from the $2.3540 swing high to the $2.2081 low.
The next resistance is $2.250. A clear move above the $2.250 resistance might send the price toward the $2.280 resistance. Any more gains might send the price toward the $2.30 resistance or even $2.3250 in the near term. The next major hurdle for the bulls might be $2.40.
Another Drop?
If XRP fails to clear the $2.220 resistance zone, it could start another decline. Initial support on the downside is near the $2.1250 level. The next major support is near the $2.080 level.
If there is a downside break and a close below the $2.080 level, the price might continue to decline toward the $2.050 support. The next major support sits near the $2.00 zone.
Technical Indicators
Hourly MACD – The MACD for XRP/USD is now gaining pace in the bearish zone.
Hourly RSI (Relative Strength Index) – The RSI for XRP/USD is now below the 50 level.
Major Support Levels – $2.120 and $2.080.
Major Resistance Levels – $2.20 and $2.220.

Crypto Analyst Says XRP Community Should Pay Attention To June 4-6, Here’s Why
XRP’s price is now looking to break above $2.20 again after inching a few moves upwards in the past ...
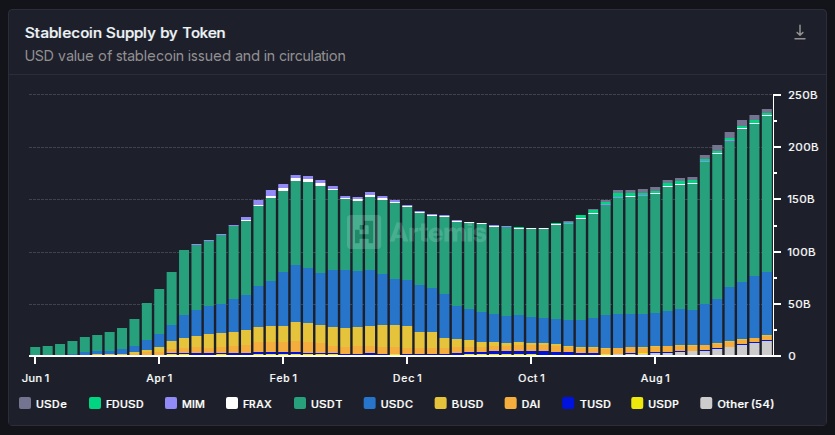
Stablecoins Ignite Record-Breaking May, Supply Jumps To $244B – Data
A surge of stablecoin transactions marked May as a standout month for the crypto sector. It moved be...
XRP Sell-Off Rumors Swirl After Expert Questions Ripple’s War Chest
CoinRoutes chief executive Dave Weisberger detonated a fresh round of anxiety in the XRP market on M...