XRP Price Coils for a Breakout — Is The Next Leg Up Imminent?


XRP price started a fresh decline below the $2.3350 zone. The price is now recovering losses and might aim for an upside break above $2.40.
- XRP price started a fresh decline below the $2.40 zone.
- The price is now trading near $2.350 and the 100-hourly Simple Moving Average.
- There is a connecting bearish trend line forming with resistance at $2.3620 on the hourly chart of the XRP/USD pair (data source from Kraken).
- The pair might start another decline if it stays below the $2.420 resistance.
XRP Price Eyes Upside Break
XRP price started a fresh decline below the $2.420 zone, unlike Bitcoin and Ethereum . There was a move below the $2.40 and $2.3650 levels. The price tested the $2.3150 zone.
A low was formed at $2.3157 and the price is now attempting to recover. There was a move above the $2.335 and $2.350 levels. The price tested the 50% Fib retracement level of the downward move from the $2.4068 swing high to the $2.3157 high.
However, the price now faces hurdles near the $2.3650 level. There is also a connecting bearish trend line forming with resistance at $2.3620 on the hourly chart of the XRP/USD pair.
The price is now trading near $2.35 and the 100-hourly Simple Moving Average. On the upside, the price might face resistance near the $2.3650 level. The first major resistance is near the $2.3850 level. It is near the 76.4% Fib retracement level of the downward move from the $2.4068 swing high to the $2.3157 high.
The next resistance is $2.420. A clear move above the $2.420 resistance might send the price toward the $2.450 resistance. Any more gains might send the price toward the $2.50 resistance or even $2.550 in the near term. The next major hurdle for the bulls might be $2.650.
Another Decline?
If XRP fails to clear the $2.420 resistance zone, it could start another decline. Initial support on the downside is near the $2.3150 level. The next major support is near the $2.30 level.
If there is a downside break and a close below the $2.30 level, the price might continue to decline toward the $2.220 support. The next major support sits near the $2.20 zone.
Technical Indicators
Hourly MACD – The MACD for XRP/USD is now losing pace in the bearish zone.
Hourly RSI (Relative Strength Index) – The RSI for XRP/USD is now above the 50 level.
Major Support Levels – $2.3150 and $2.30.
Major Resistance Levels – $2.420 and $2.50.
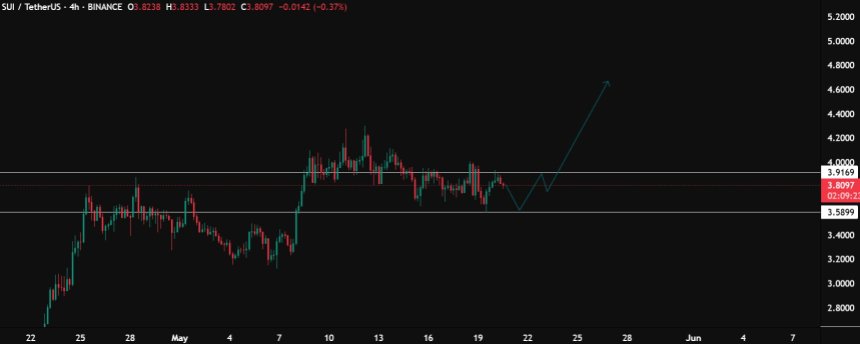
SUI Preparing For Another Leg Up – Is $5 The Next Target?
After its breakout, SUI has been consolidating within a key range and has faced momentary resistance...
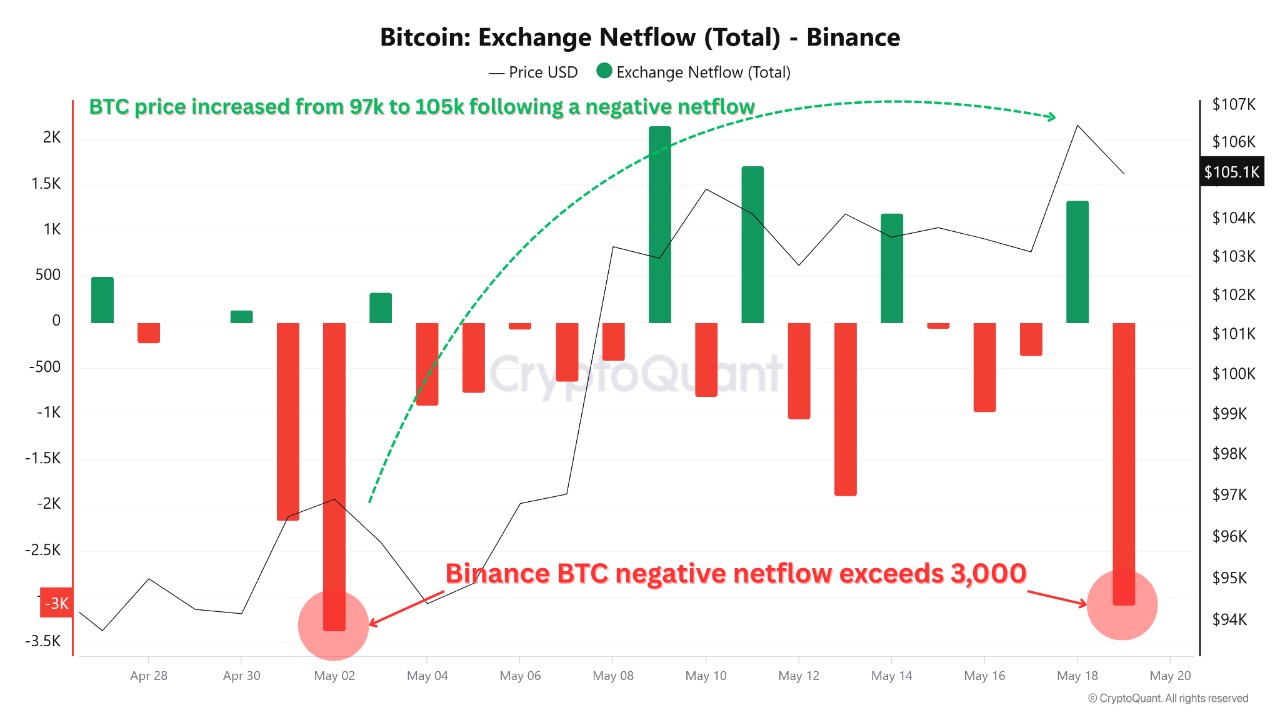
Binance Bitcoin Outflows and MVRV Ratio Point to Sustained Bullish Setup, Analyst Reveals
Bitcoin (BTC) has seen a slight retreat after reaching an intraday high of $106,704. At the time of ...
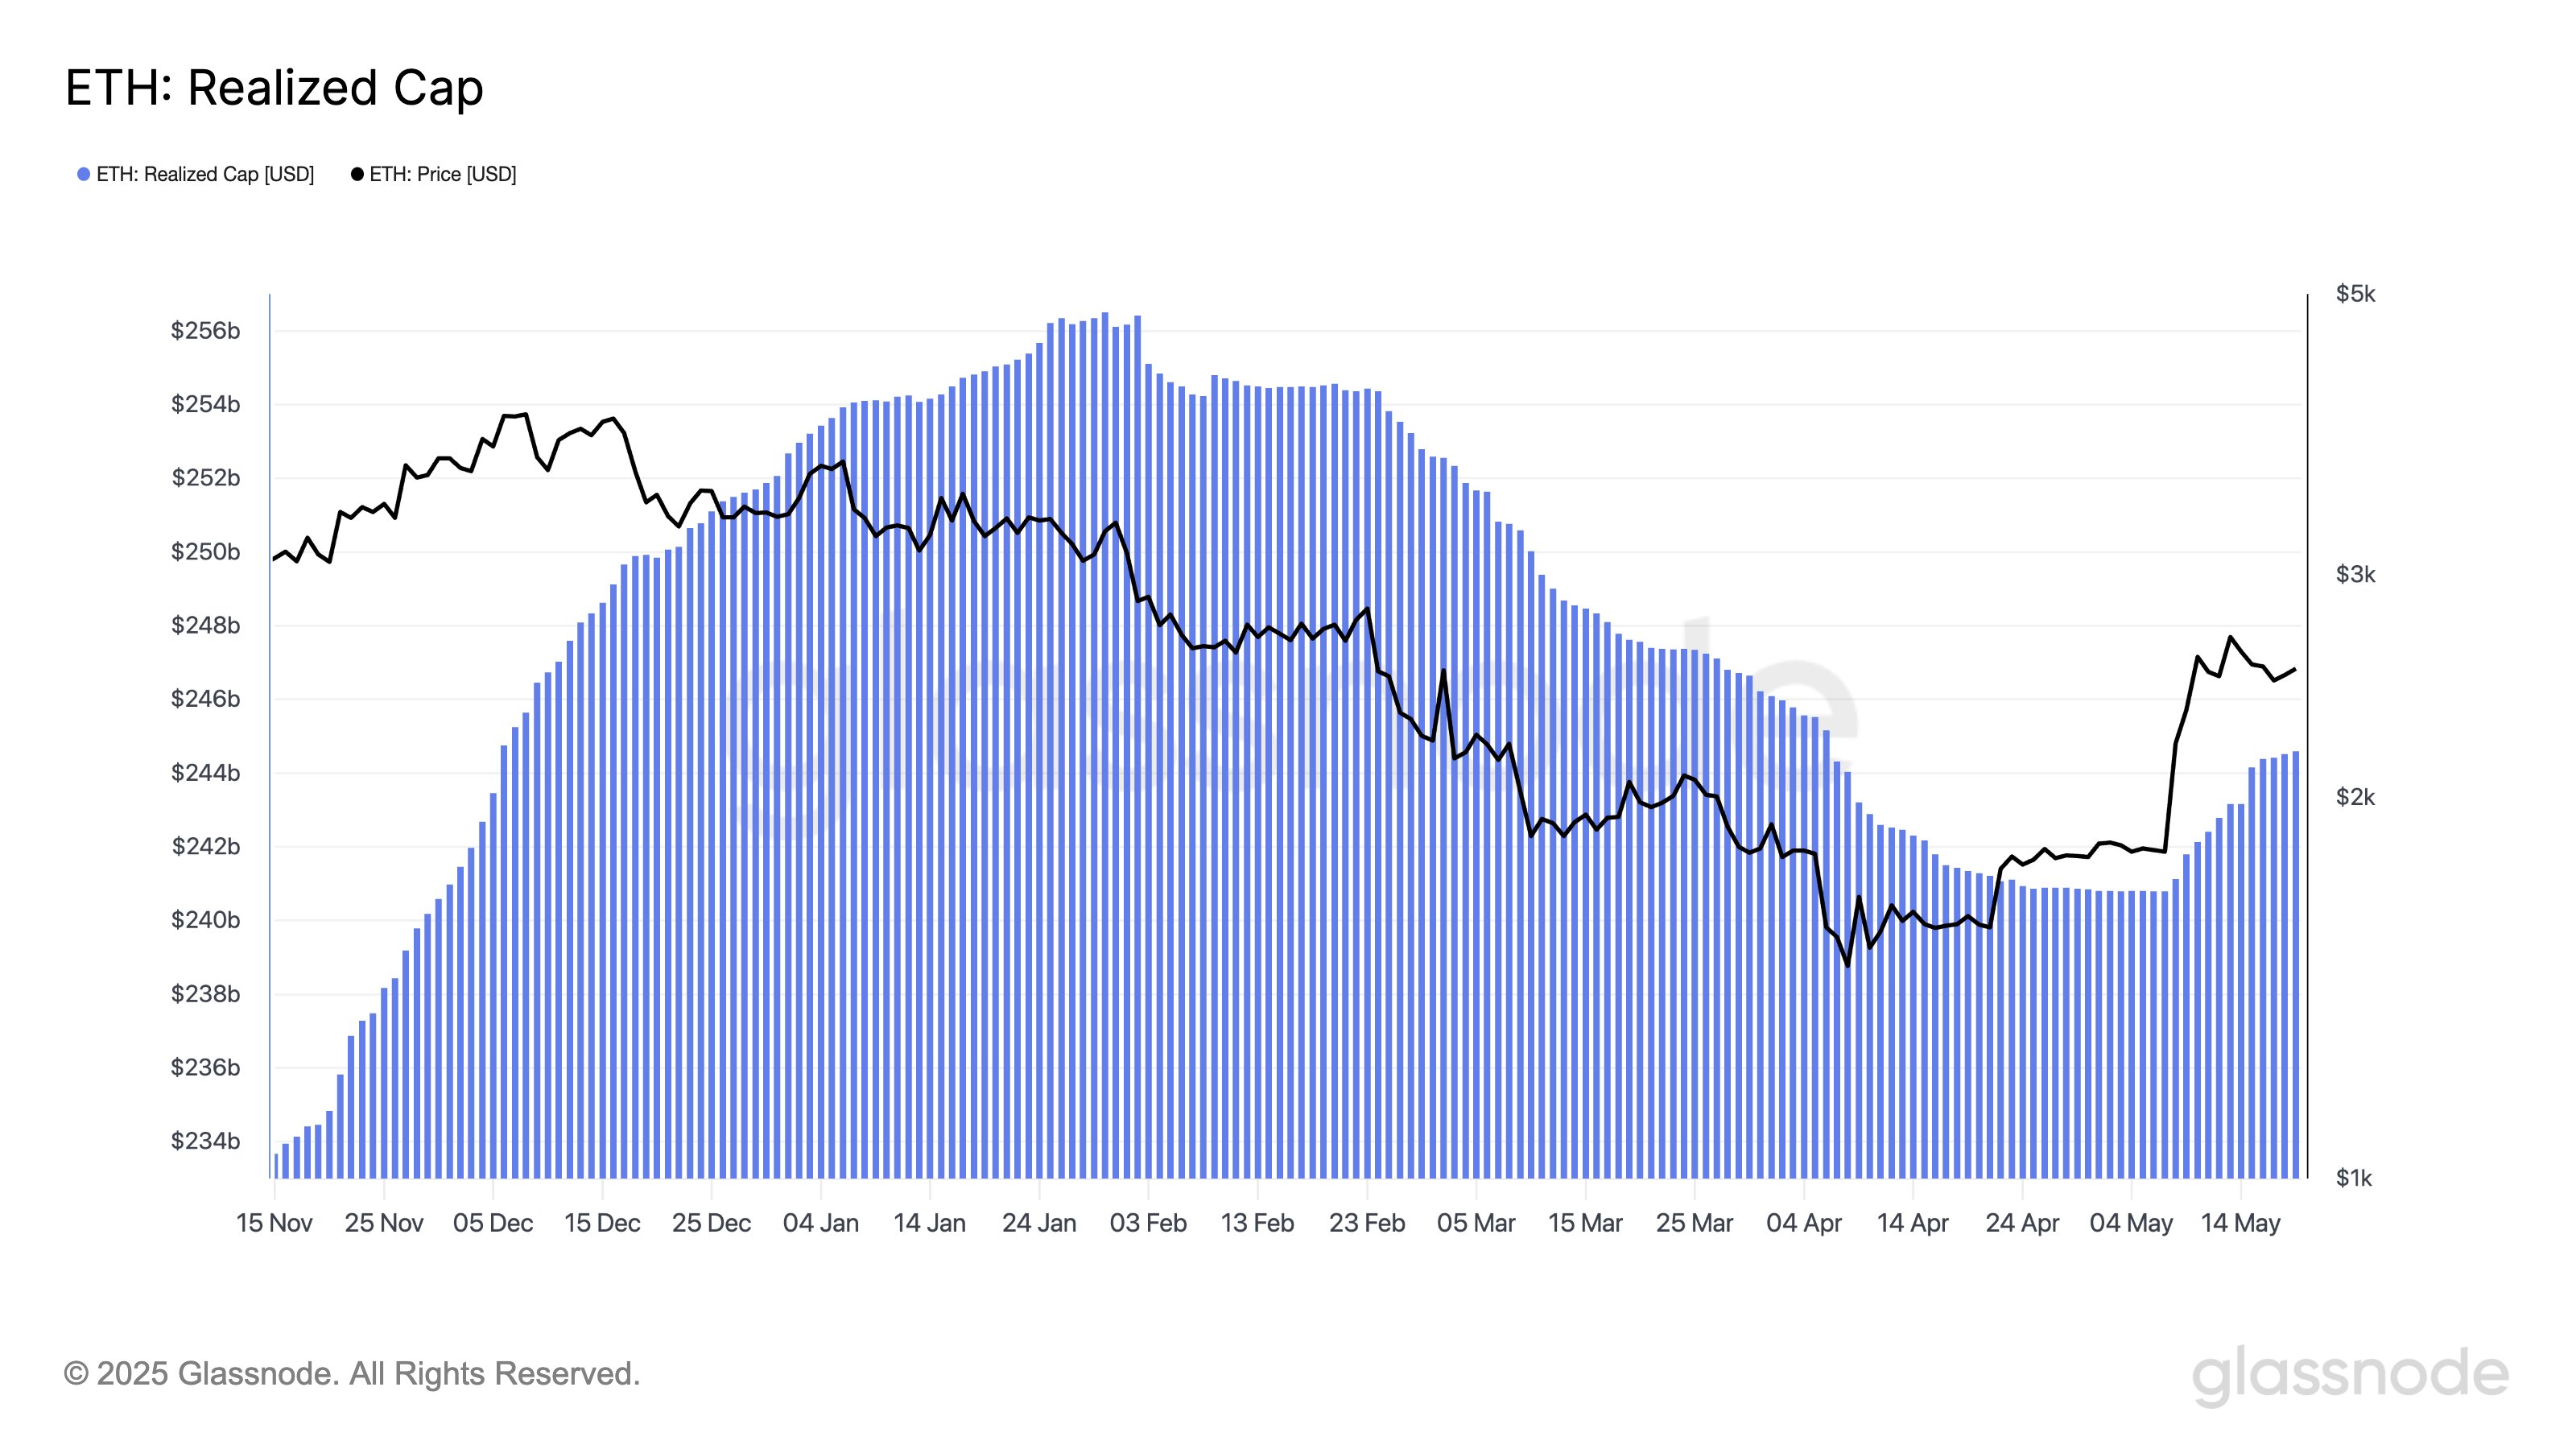
$3.8 Billion In Capital Inflows Behind Ethereum’s Post-Pectra Surge, Data Shows
On-chain data shows Ethereum has seen a significant rise in its Realized Cap recently, signaling the...