Cardano Market Structure Says Crash Is Coming, But $0.9 Is Still In The Cards


Cardano (ADA) is flashing mixed signals as its market structure hints at an imminent short-term price crash . While bearish indicators suggest a possible decline, a crypto analyst reveals that the broader trend remains intact, with technical patterns supporting the potential for a rally toward the $0.9 mark.
Cardano Price Crash Incoming
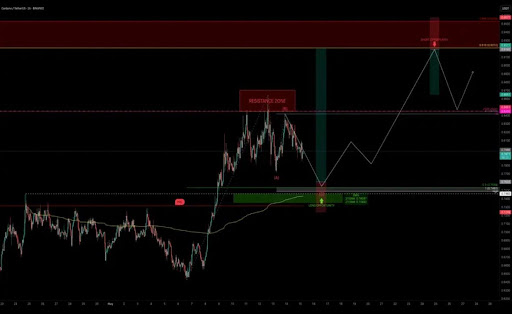
TradingView Crypto analyst SiDec has released a bearish price forecast for Cardano , anticipating a significant correction toward the $0.75 area in the coming days. This cautious outlook is based on detailed analysis using Elliott Wave Theory , Fibonacci tools, and critical price action zones.
SiDec has stated that ADA’s price continues to consolidate after completing a 5-wave impulse move, signaling the end of its upward momentum. Following this strong impulse rally, the cryptocurrency is now exhibiting a classic Elliott Wave behavior, transitioning into a textbook ABC corrective pattern .
The cryptocurrency first experienced a pull-back, labeled as Wave A on the price chart, followed by a temporary recovery in Wave B. According to SiDec, Wave C is expected to complete the retracement pattern, with ADA’s final downward move nearing its end.
Currently, technical indicators and price action point to the $0.705 region as a high-probability long entry zone. The TradingView analyst also clarifies where ADA might find solid support during this corrective phase using Fibonacci Retracement zones .

The 50% retracement level of the entire bullish 5-wave impulse is positioned approximately at $0.7534 — a critical price point that coincides closely with ADA’s previous price swing at $0.746. This former resistance level has yet to be revisited, making it a natural support candidate.
The analysis further identifies a 1:1 ABC extension for the anticipated correction in ADA, placing Wave C’s potential crash target around $0.7492. This also creates a tight cluster of technical indicators in the range of roughly $0.75, indicating a strong support zone.
Further supporting this level, the daily 21 Exponential Moving Average (EMA) stands at $0.7455, while the daily 21 Simple Moving Average (SMA) is slightly lower at $0.7347. SiDec has also identified the Point of Control (POC), which marks the price with the highest volume, near $0.7318.
The analyst further highlights that Cardano’s anchored Volume Weighted Average Price (VWAP) resides within the $0.75 support zone. At the same time, the Pitchfork tool’s golden pocket aligns dynamically as support around the same area.
ADA Price Path To $0.92 Holds Firm
While SiDec eyes a potential crash to new lows for ADA in the near term, the analyst’s chart also shows a green zone, with a projected bullish bounce drawn. Following its Wave C crash, Cardano is expected to rebound and approach the $0.92 level.
The TradingView analyst has advised caution around this area, as $0.92 acts as a significant resistance zone and coincides with a prior liquidity zone that could trigger rejection or profit-taking .
SiDec has emphasized that the risk-to-reward ratio around this area will only become favorable once there is clear confirmation, such as an SFP, a bearish engulfing candle, or visible divergence. Overall, if the $0.75 support zone holds, Cardano, which is currently trading at $0.78, could be positioned for a strong recovery toward $0.92 and beyond.


Bitcoin Options Market Signals Further Upside Potential For BTC Price: New ATH Soon?
Following the return above $100,000 in the previous week, Bitcoin has fought well to maintain its ho...

Trump Token Mania: Over 6,000% Pump Or Classic Solana Trap?
According to blockchain data, a new Solana token named Eric Trump shot up 6,200% in just 24 hours. I...

Bitcoin Consolidates Below ATH – Buying Pressure Weakens As Equities Outperform
Bitcoin is facing growing risks of a pullback as bullish momentum begins to fade near key resistance...

