Solana (SOL) Finds Support — Rally May Be Ready to Resume


Solana started a fresh increase above the $175 zone. SOL price is now correcting gains and might find bids near the $172 support zone.
- SOL price started a fresh upward move above the $160 and $165 levels against the US Dollar.
- The price is now trading near $175 and the 100-hourly simple moving average.
- There is a short-term declining channel or a bullish flag forming with support at $172 on the hourly chart of the SOL/USD pair (data source from Kraken).
- The pair could start a fresh increase if it clears the $180 resistance zone.
Solana Price Corrects Gains
Solana price formed a base above the $155 support and started a fresh increase, like Bitcoin and Ethereum . SOL gained pace for a move above the $160 and $165 resistance levels.
However, the bears were active below the $185 resistance zone. A high was formed at $184.75 and the price corrected some gains. The price dipped below $180 and $178. The price dipped below the 50% Fib retracement level of the upward move from the $166 swing low to the $185 high.
However, the bulls are active above the $172 level and the 61.8% Fib retracement level of the upward move from the $166 swing low to the $185 high. Solana is now trading near $175 and the 100-hourly simple moving average. There is also a short-term declining channel or a bullish flag forming with support at $172 on the hourly chart of the SOL/USD pair.
On the upside, the price is facing resistance near the $178 level. The next major resistance is near the $180 level. The main resistance could be $185. A successful close above the $185 resistance zone could set the pace for another steady increase. The next key resistance is $192. Any more gains might send the price toward the $200 level.
Downside Correction in SOL?
If SOL fails to rise above the $180 resistance, it could start another decline. Initial support on the downside is near the $172 zone. The first major support is near the $170 level.
A break below the $170 level might send the price toward the $162 zone. If there is a close below the $162 support, the price could decline toward the $150 support in the near term.
Technical Indicators
Hourly MACD – The MACD for SOL/USD is losing pace in the bullish zone.
Hourly Hours RSI (Relative Strength Index) – The RSI for SOL/USD is below the 50 level.
Major Support Levels – $172 and $170.
Major Resistance Levels – $180 and $185.

Are Bitcoin Whales About to Cash Out? Key Metric Signals Possible Profit-Taking Ahead
Bitcoin’s recent market movement reflects ongoing upward momentum, even as short-term fluctuations s...

Bitcoin Exchange Stablecoins Ratio Surges—A Warning For Investors?
On-chain data shows the ‘Exchange Stablecoins Ratio’ for Bitcoin has shot up recently. Here’s what i...
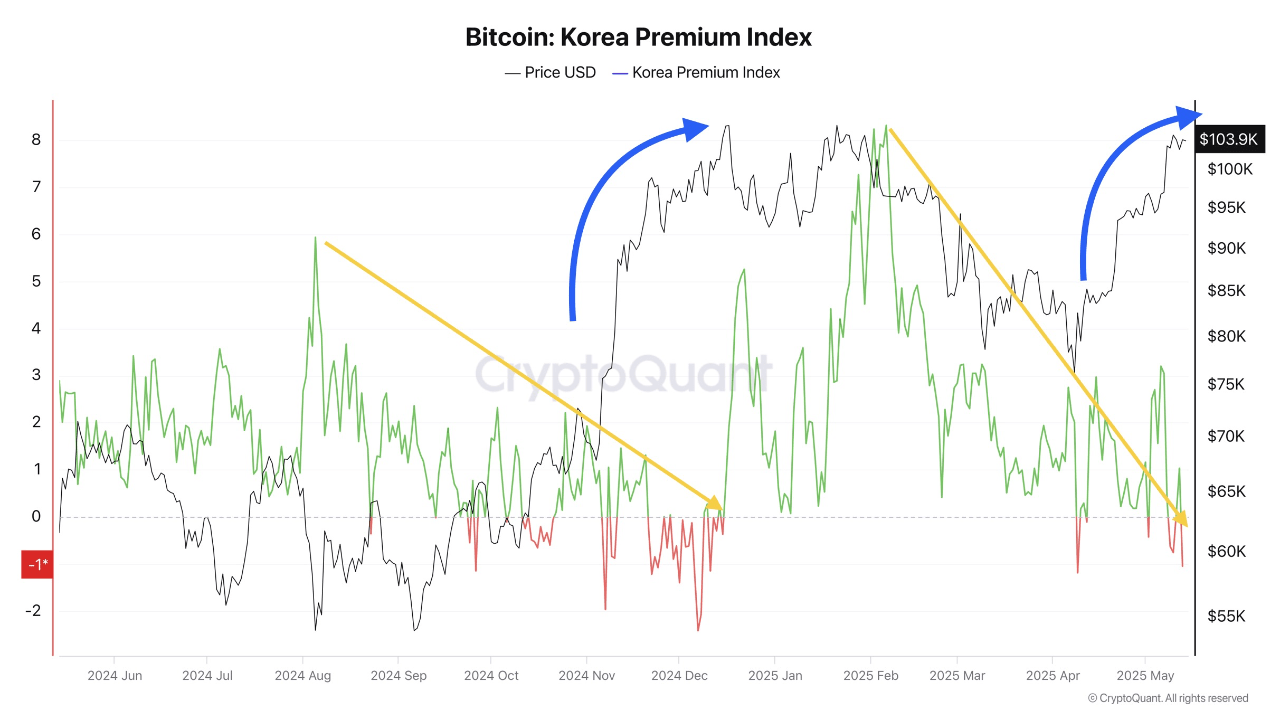
Bitcoin Tops $104K as Global Market Momentum Outpaces Korean Demand
Bitcoin has continued its steady ascent, with the asset now trading above $103,000. This marks a 0.4...