SUI Consolidates Near $4 as Breakout Pattern Draws Technical Attention


- SUI forms a symmetrical triangle, hinting at an 8% breakout move.
- Trading volume drops 48.79% as price volatility stays high within a narrow range.
- SUI holds $13.09B market cap with mixed sentiment ahead of breakout confirmation.
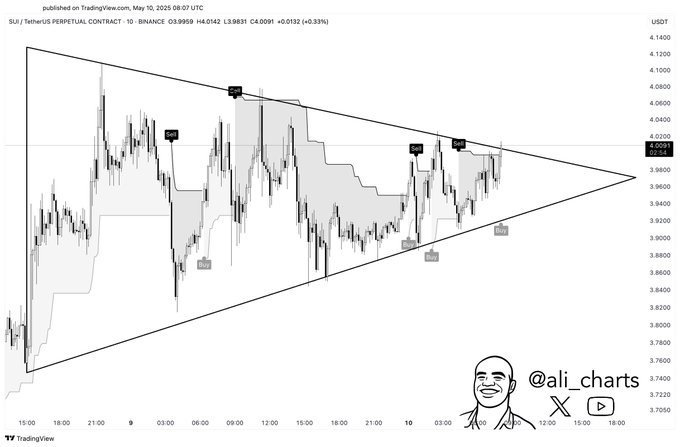
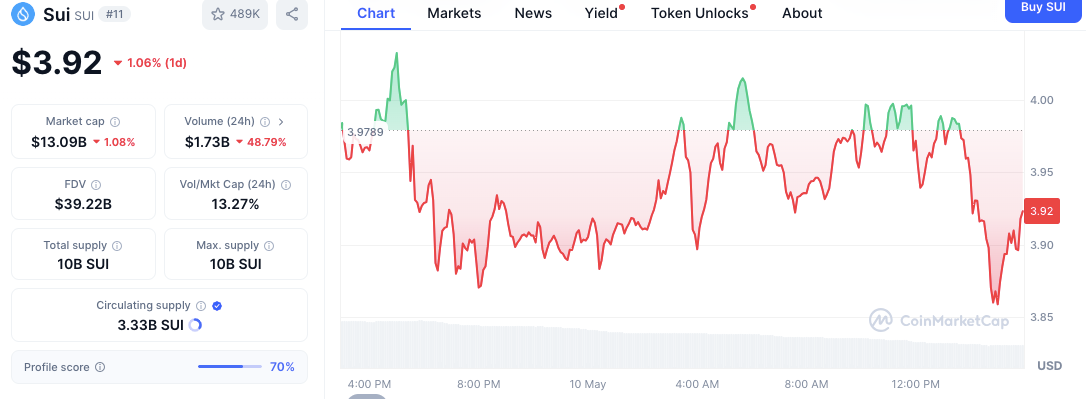
A symmetrical triangle pattern forming on the SUI/USDT 1-hour chart is capturing the attention of market analysts and traders, signaling a possible price movement of up to 8%. The structure on a TradingView chart published on May 10, 2025, shows price consolidation within converging trendlines, an ascending support line, and a descending resistance line. As of the latest update, SUI is trading at $3.92, a 1.06% decline over the past 24 hours, according to CoinMarketCap.
Technical indicators highlight increased trading activity around the triangle’s boundaries. Buy signals have consistently appeared near the support trendline, while sell signals were recorded near the upper resistance line, indicating repeated attempts at swing trades within the narrowing range. These automated signals appear tied to algorithmic responses to volatility inside the pattern.
A shaded area within the chart, resembling a volatility-weighted channel, further reinforces the tightening movement of price action. With the triangle’s apex approaching, traders prepare for a breakout in either direction. A successful move above the resistance line may open a short-term target near $4.12. Conversely, failure to maintain current levels could lead to a retest of the $3.85 to $3.80 support zone.

Price Volatility Increases Amid Lower Volume
SUI briefly crossed above $4.00 earlier in the session but met persistent resistance near that level, leading to a retracement below the psychological barrier. Intraday price movements remained confined between $3.85 and $4.00, reflecting elevated volatility in a narrow price corridor.
Despite initial bullish attempts, trading volume has dropped sharply. Over the past 24 hours, volume declined by 48.79% to $1.73 billion. The volume-to-market cap ratio now stands at 13.27%, suggesting moderate liquidity compared to overall market capitalization. The data points to a temporary slowdown in market participation, even as price volatility remains high.
Market Position and Technical Context

SUI stands at #11 by market capitalization, a total of $13.09b. Its fully diluted valuation (FDV) is $39.22 billion, on a maximum token supply 10 billion. Approximately 3.33 billion SUI tokens are in circulation of this total.
Market sentiment seems to be in turmoil, with many intraday reversals and no breakout direction confirmed. The symmetrical triangle pattern continues as the traders look for confirmation whether its breakout or breakdown. It is possible that the next price move would clarify a clear short-term trend, if SUI breaches resistance or tests support.

Bitcoin Price Surge To $150,000: Standard Chartered Analysts Reveal Likely Timeline, FloppyPepe (FPPE) To Surge 10,000% First
Standard Chartered predicts Bitcoin could hit $150,000, but FloppyPepe (FPPE) may surge 10,000% firs...

Belo Horizonte Passes Crypto Bill to Make City Become Bitcoin Capital
Belo Horizonte passed a bill seeking to encourage businesses to accept crypto as payments. The bill ...

Web3 ai’s Smart Alerts and 1747% ROI Make It 2025’s Top Pick, While Dogecoin Relies on Hype and Stellar Awaits Adoption
Compare Web3 ai, Dogecoin (DOGE), and Stellar (XLM). See why Web3 ai’s real-time tools bring stronge...

