BNB Price Reclaims $600 — Is This the Start of a Major Upside Move?


BNB price is rising from the $580 support zone. The price is now consolidating gains above $600 and might aim for more gains in the near term.
- BNB price is attempting to recover above the $615 resistance zone.
- The price is now trading above $600 and the 100-hourly simple moving average.
- There is a connecting bullish trend line forming with support at $611 on the hourly chart of the BNB/USD pair (data source from Binance).
- The pair must stay above the $600 level to start another increase in the near term.
BNB Price Eyes More Upsides
After forming a base above the $580 level, BNB price started a fresh increase. There was a move above the $595 and $600 resistance levels, like Ethereum and Bitcoin .
The bulls even pushed the price above the $610 level. A high was formed at $620 before there was a minor downside correction. The price dipped below the 23.6% Fib retracement level of the upward move from the $594 swing low to the $620 high.
The price is now trading above $600 and the 100-hourly simple moving average. There is also a connecting bullish trend line forming with support at $611 on the hourly chart of the BNB/USD pair.
On the upside, the price could face resistance near the $618 level. The next resistance sits near the $620 level. A clear move above the $620 zone could send the price higher. In the stated case, BNB price could test $635. A close above the $635 resistance might set the pace for a larger move toward the $650 resistance. Any more gains might call for a test of the $665 level in the near term.
Another Decline?
If BNB fails to clear the $620 resistance, it could start another decline. Initial support on the downside is near the $611 level. The next major support is near the $607 level and the 50% Fib retracement level of the upward move from the $594 swing low to the $620 high.
The main support sits at $600. If there is a downside break below the $600 support, the price could drop toward the $585 support. Any more losses could initiate a larger decline toward the $580 level.
Technical Indicators
Hourly MACD – The MACD for BNB/USD is gaining pace in the bullish zone.
Hourly RSI (Relative Strength Index) – The RSI for BNB/USD is currently above the 50 level.
Major Support Levels – $611 and $607.
Major Resistance Levels – $618 and $620.
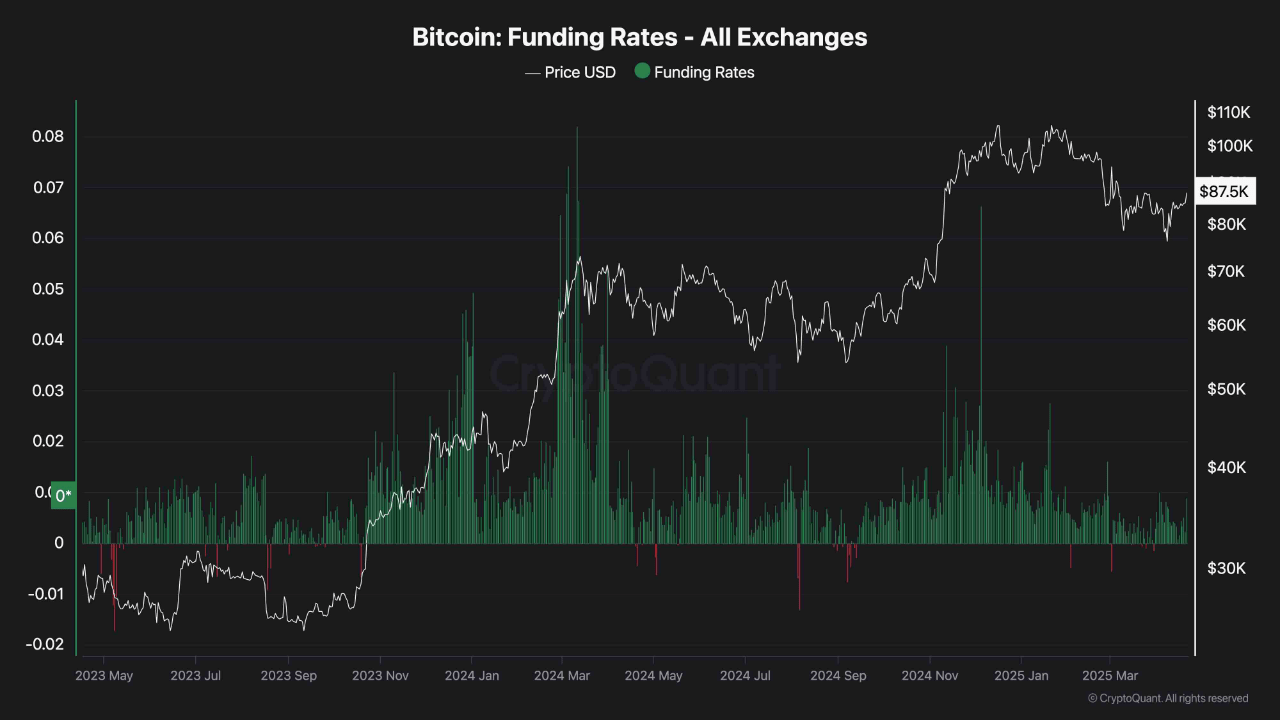
Bitcoin Regains $90K With Funding Rates Indicating Momentum Toward $93K
Bitcoin has finally reclaimed the psychologically $90,000 level once again following a recent period...
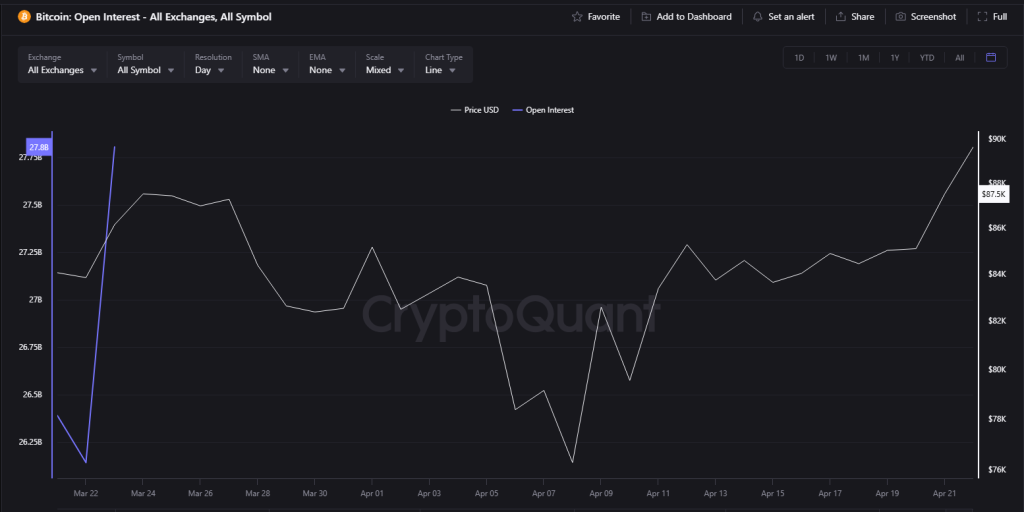
Bitcoin Rockets To Monthly Highs As Open Interest Explodes By Over $3 Billion
Bitcoin rose to $89,292 today, its highest since April 2, as traders injected funds into cryptocurre...
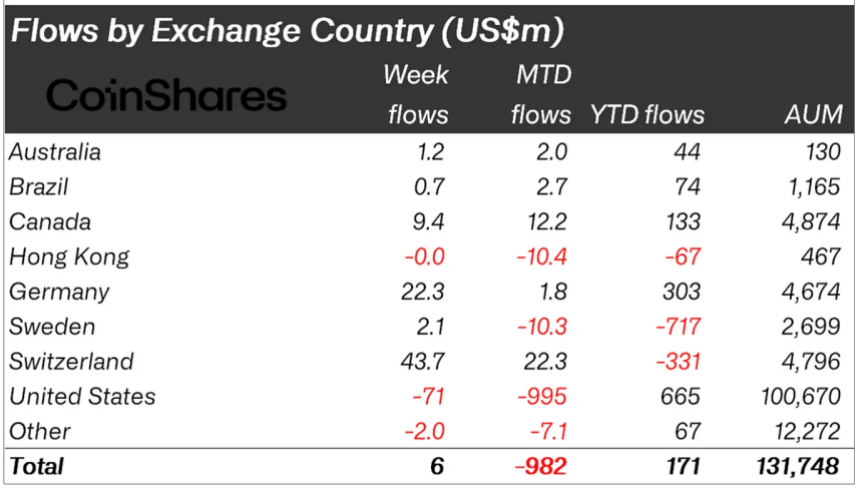
XRP Gains Ground in Weekly Crypto Inflows as Ethereum Continues Downtrend
According to CoinShares’ latest weekly report, crypto investment products registered slight net infl...