BNB Price Eyes Breakout, But $600 Remains A Stubborn Ceiling


BNB price is recovering from the $575 support zone. The price is now consolidating gains and might face hurdles near $585 and $600.
- BNB price is attempting to recover above the $580 resistance zone.
- The price is now trading below $585 and the 100-hourly simple moving average.
- There is a connecting bearish trend line forming with resistance at $585 on the hourly chart of the BNB/USD pair (data source from Binance).
- The pair must stay above the $575 level to start another increase in the near term.
BNB Price Faces Resistance
After struggling to clear the $595 resistance, BNB price started a fresh decline. There was a move below the $590 and $585 levels, like Ethereum and Bitcoin .
A low was formed at $576 and the price is now attempting to recover. There was a move above the $580 level. The price climbed above the 23.6% Fib retracement level of the downward move from the $594 swing high to the $576 low.
The price is now trading below $585 and the 100-hourly simple moving average. On the upside, the price could face resistance near the $585 level. There is also a connecting bearish trend line forming with resistance at $585 on the hourly chart of the BNB/USD pair.
The next resistance sits near the $588 level and the 61.8% Fib retracement level of the downward move from the $594 swing high to the $576 low. A clear move above the $588 zone could send the price higher. In the stated case, BNB price could test $595. A close above the $595 resistance might set the pace for a larger move toward the $600 resistance. Any more gains might call for a test of the $620 level in the near term.
Another Decline?
If BNB fails to clear the $585 resistance, it could start another decline. Initial support on the downside is near the $580 level. The next major support is near the $575 level.
The main support sits at $562. If there is a downside break below the $562 support, the price could drop toward the $550 support. Any more losses could initiate a larger decline toward the $535 level.
Technical Indicators
Hourly MACD – The MACD for BNB/USD is losing pace in the bullish zone.
Hourly RSI (Relative Strength Index) – The RSI for BNB/USD is currently below the 50 level.
Major Support Levels – $580 and $575.
Major Resistance Levels – $585 and $595.
Bitcoin Stalls at $84K, But Analyst Says 2025 Could Mirror Last Year’s Breakout
Despite broader market interest, Bitcoin continues to hover near the $84,000 mark, showing limited u...
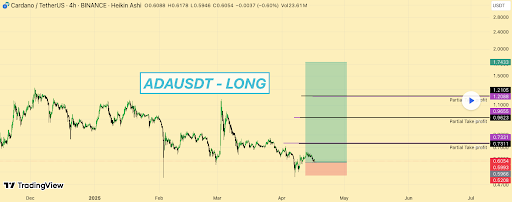
Cardano Price Surge To $1.7: Here Are The Factors To Drive The Recovery
The Cardano price may be preparing for a powerful rally toward $1.7, as new indicators suggest a pot...
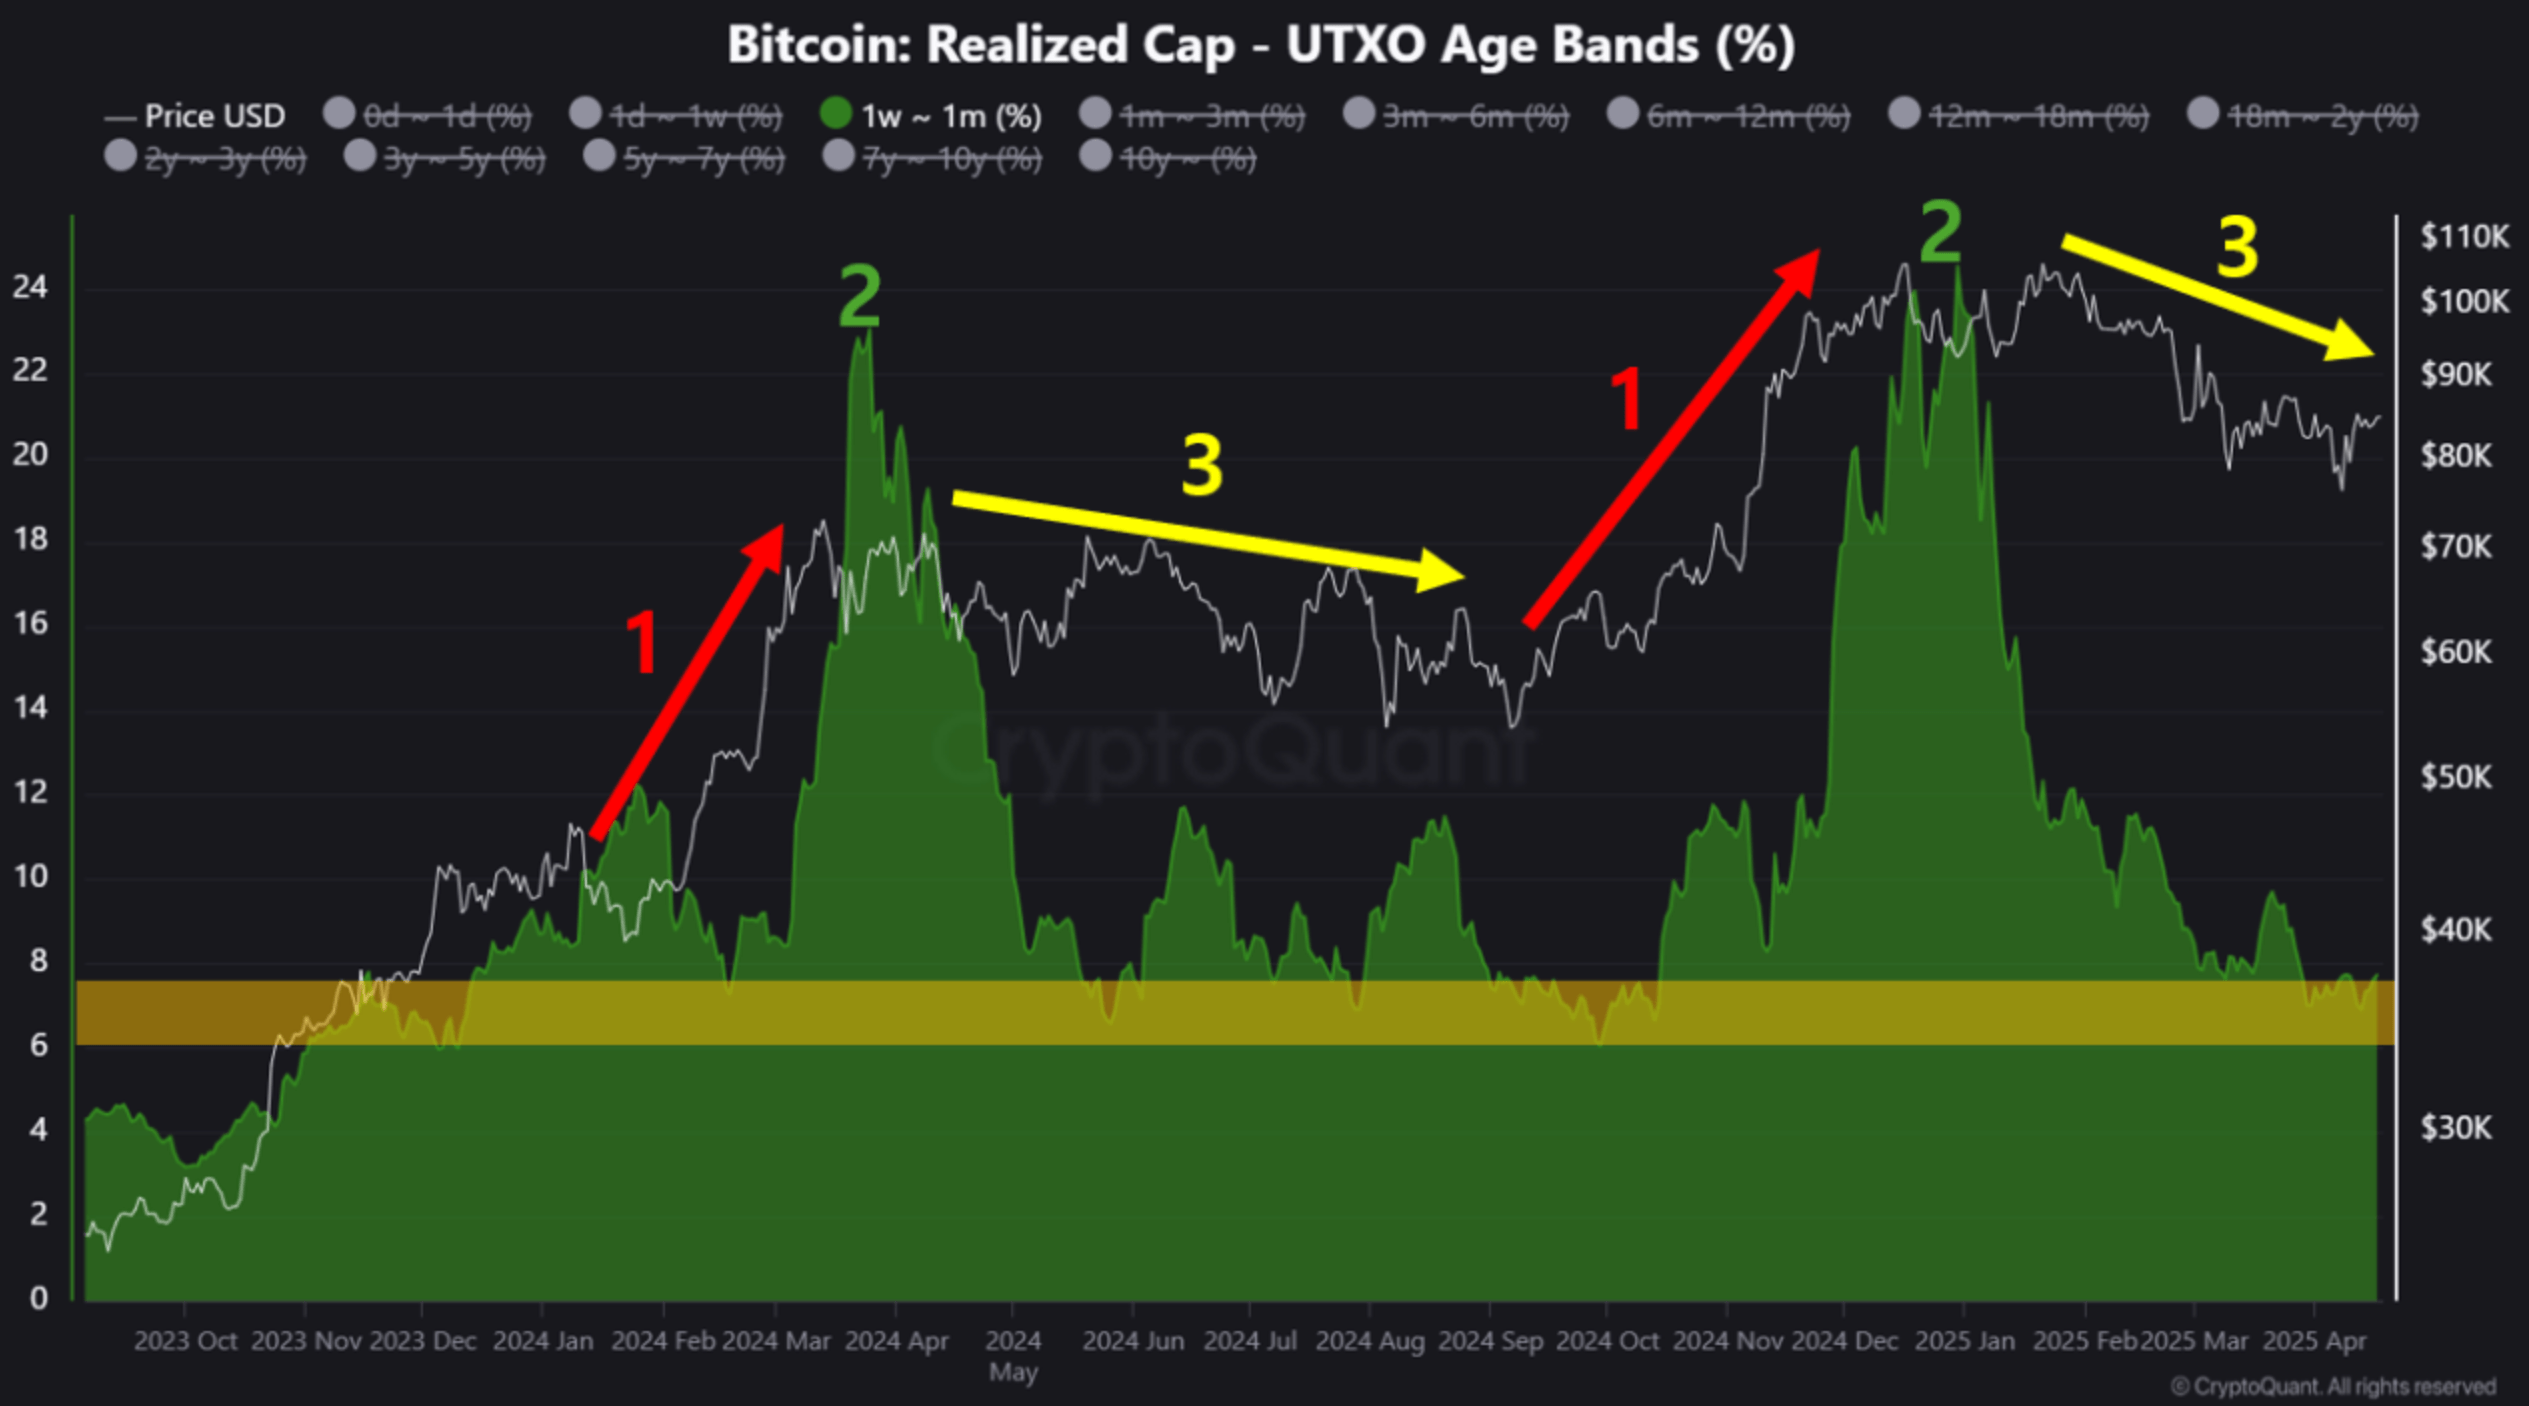
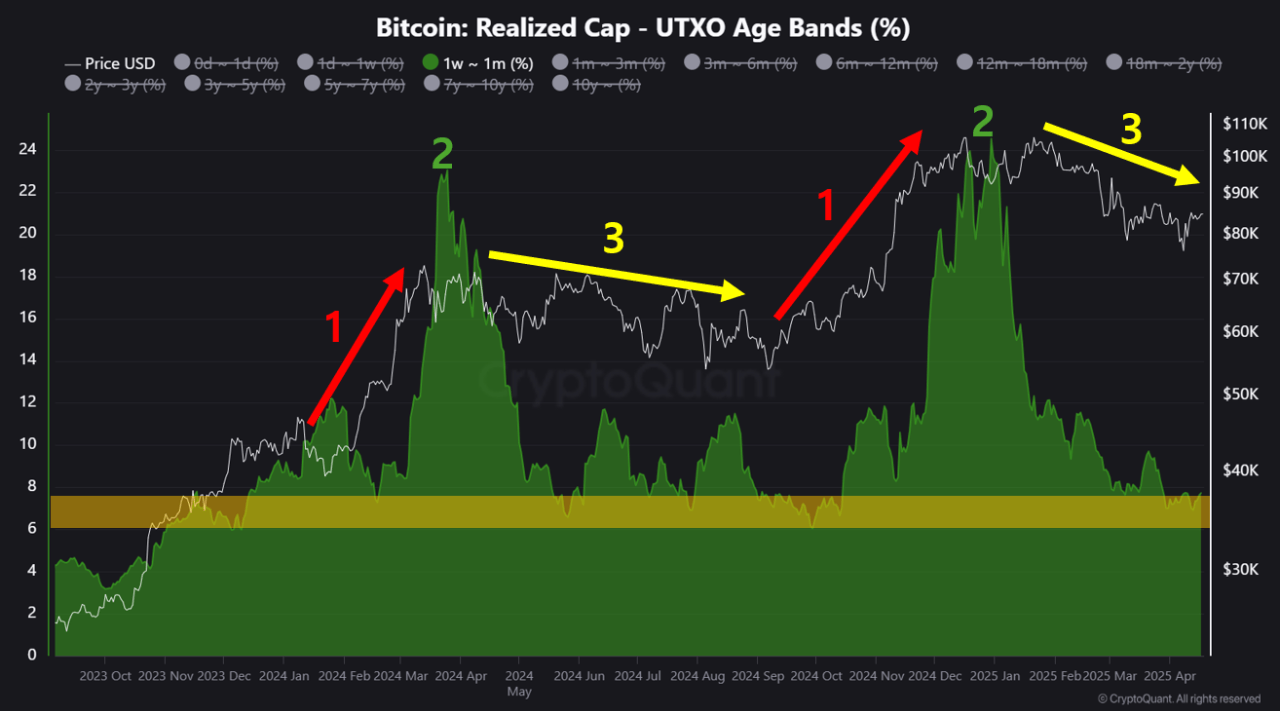
Bitcoin Enters New Phase: Analyst Predicts Positive Movement In 2025
According to a recent CryptoQuant Quicktake post, Bitcoin (BTC) may be close to completing its price...