PEPE Price To Bounce 796% To New All-Time Highs In 2025? Here’s What The Chart Says


PEPE’s price action has been relatively quiet in the past few weeks. The meme coin has been quietly going through a continued wave of selloffs amidst the volatility in the wider crypto market.
However, an interesting technical analysis shows that the chart structure of PEPEUSDT is pointing to a massive move to the upside, one that could send the token soaring by as much as 796% before the end of 2025. As the broader crypto market continues to move sideways , crypto analyst MasterAnanda identified a short-term higher low forming around support levels, which could act as the launchpad for a major PEPE price breakout.
Short-Term Higher Low Points To Strong Accumulation Zone
The bullish outlook on PEPE is based on the repeat of a similar price formation that played out in 2024 before its run to new price highs and eventually its current all-time high of $0.00002803. According to the price chart shared by the analyst on the TradingView platform, PEPE initially traded in a descending channel between May to September 2024 before eventually breaking out of the channel. After breaking out of the channel, PEPE went on a brief uptrend and another downside which led to the creation of a lower low, before eventually going on an extended rally that peaked in December 2024.
Notably, it seems the same structure is showing up again on the PEPE price chart, specifically on the daily candlestick timeframe. In the analysis, MasterAnanda marks April as the period where PEPE bottomed out within a descending channel. Since then, two distinct highs and two clear lows have shaped what appears to be a reversal structure.

Most notably, a new higher low is beginning to form a pattern that, according to previous price action, could precede a bullish wave. The analyst labels this as a important stage, especially for spot traders who are positioning for long-term growth. Although there could be weakness in the short term, which could result in one last shakeout or another downside wick, the analyst noted that this shouldn’t worry spot investors.
It may offer a final opportunity to accumulate before momentum builds toward a new cycle high. On the other hand, leveraged traders are advised to proceed with caution and risk management, given the potential volatility during the build-up to the breakout.
Fibonacci Levels Show 480% To 796% Rally Target
The chart highlights a significant confluence around Fibonacci extension levels, with the 1.618 Fib level suggesting a possible 480% move and the more ambitious 2.618 extension pointing to a 796% upside. Interestingly, MasterAnanda noted that the numbers are huge .
Although these targets are just projections, they align with the previous rally seen in late 2024. If this prediction structure holds, the next rally could push PEPE beyond the 1.618 Fib level at $0.0004264, surpassing all prior highs and printing a new all-time high in 2025.
At the time of writing, PEPE is trading at $0.00000708, down by 4.7% in the past 24 hours.

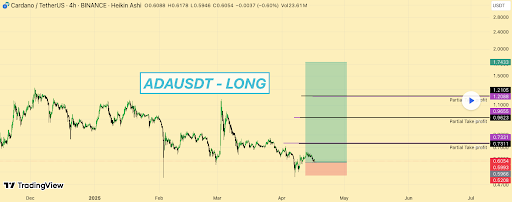
Cardano Price Surge To $1.7: Here Are The Factors To Drive The Recovery
The Cardano price may be preparing for a powerful rally toward $1.7, as new indicators suggest a pot...
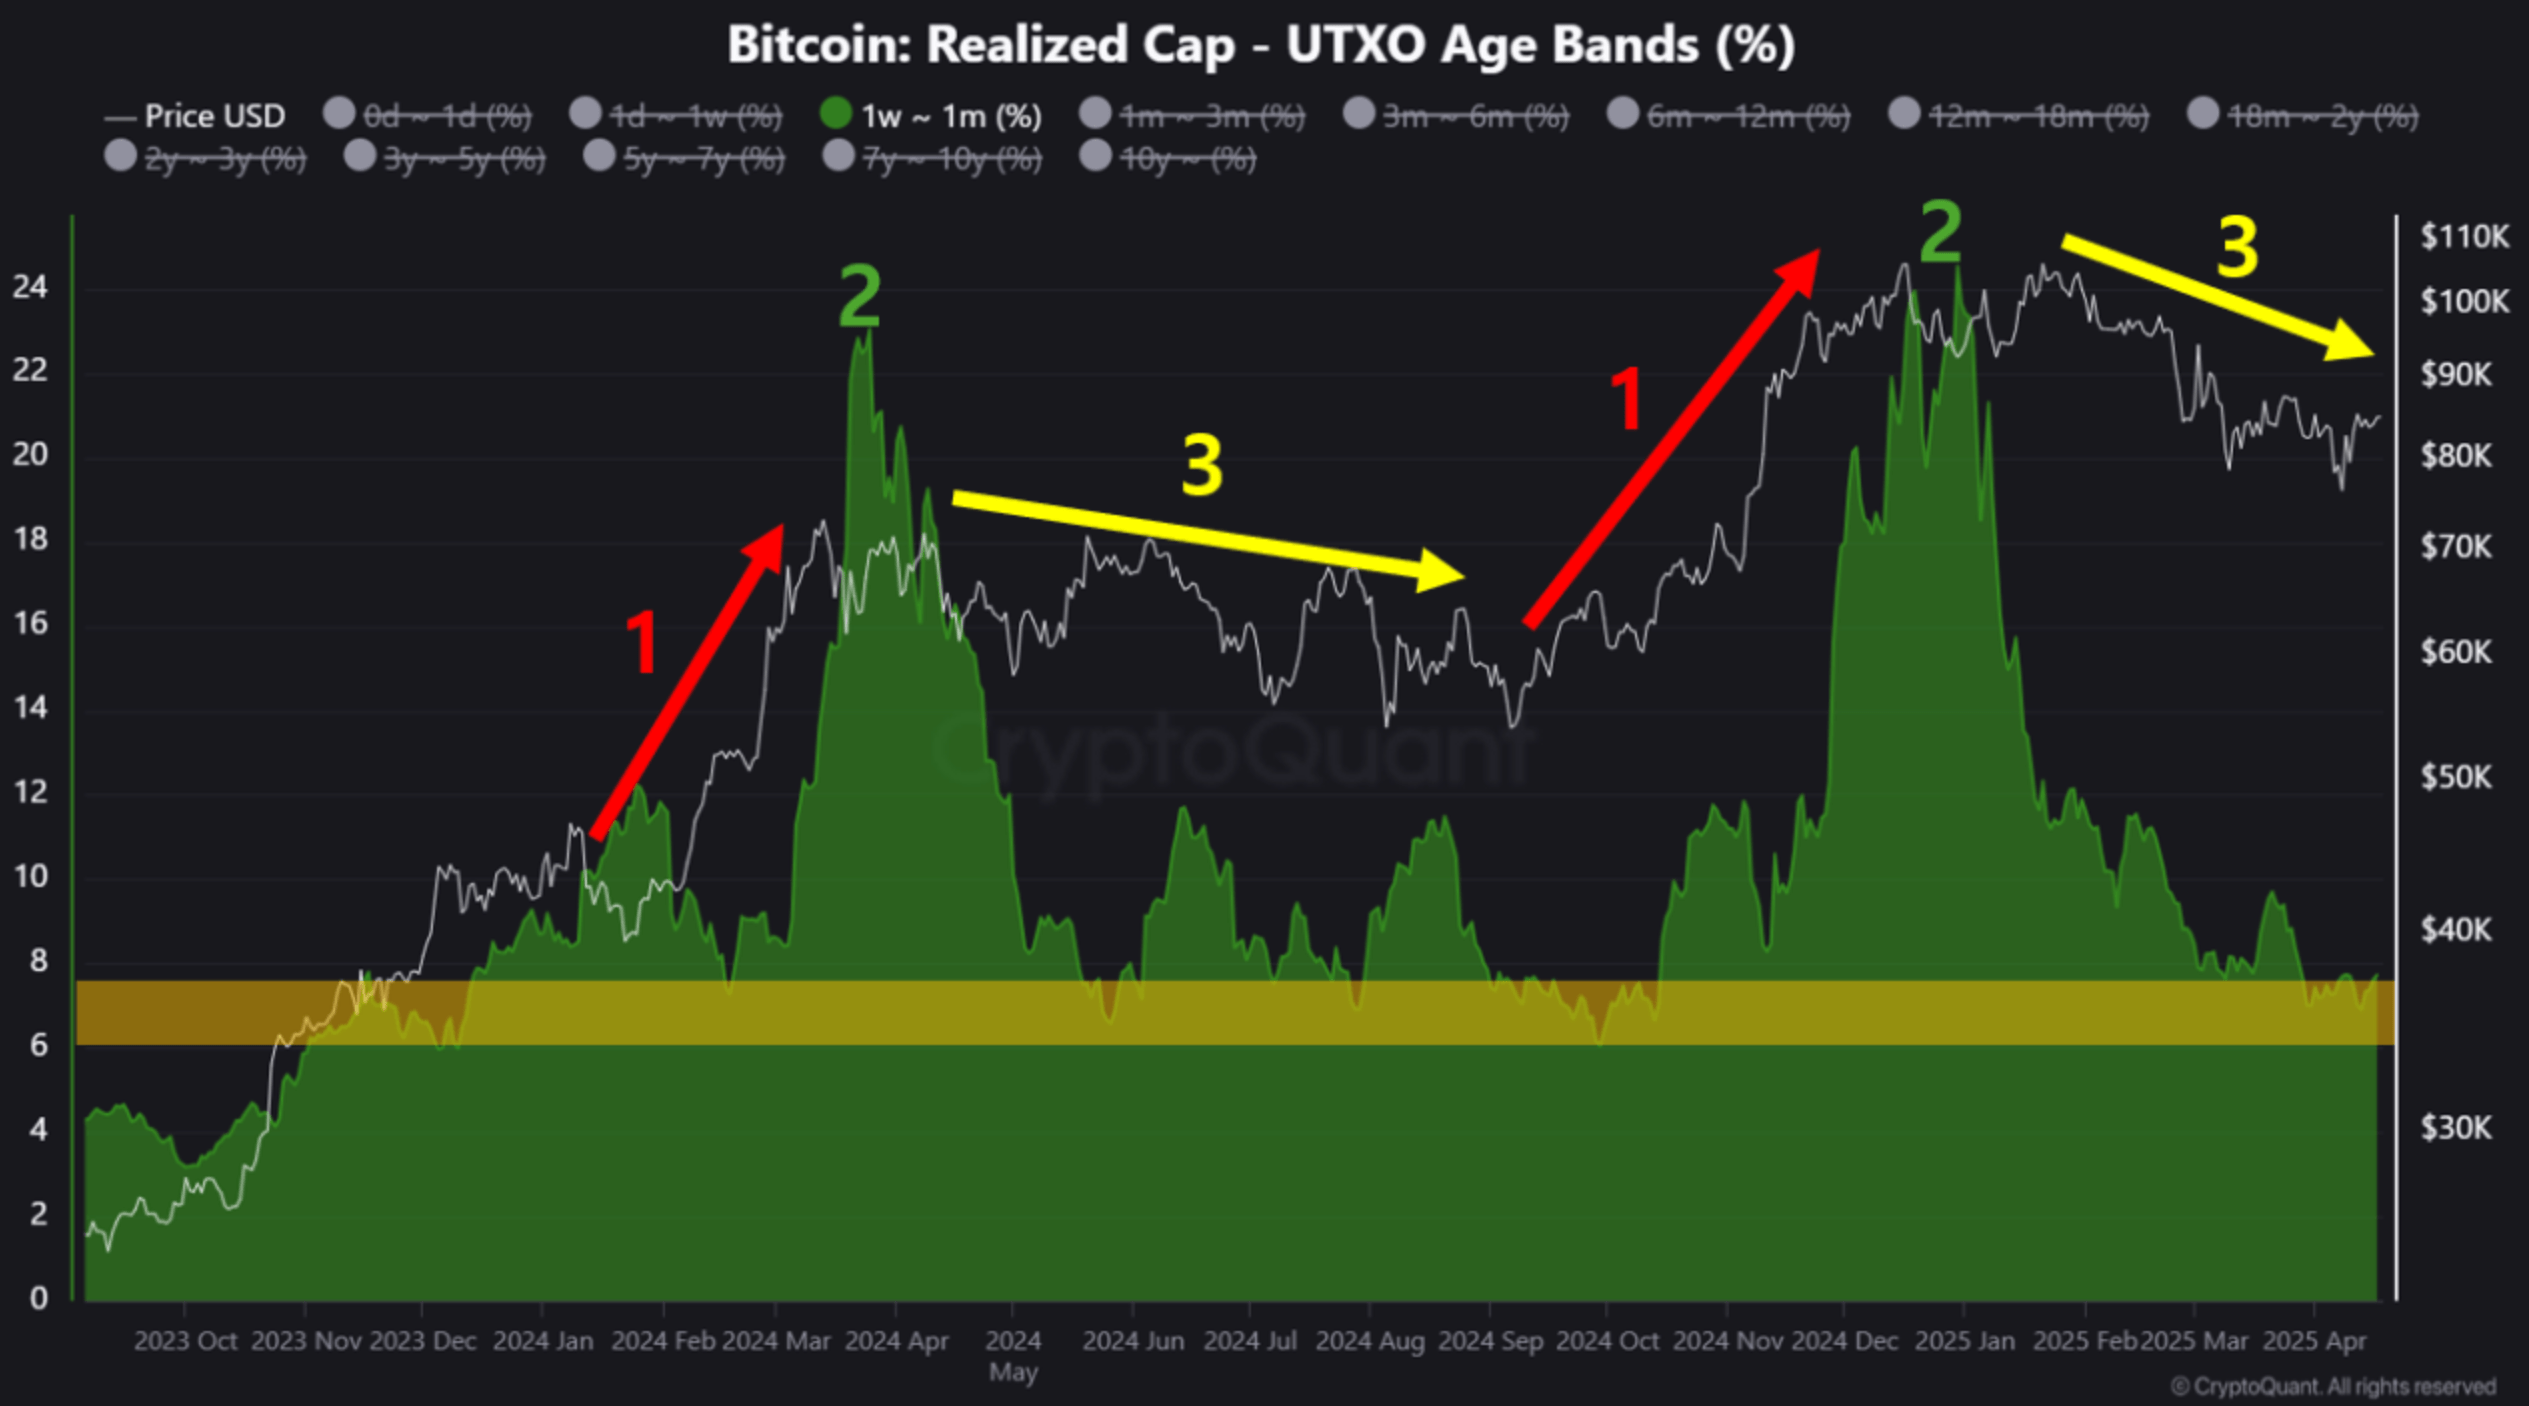
Bitcoin Enters New Phase: Analyst Predicts Positive Movement In 2025
According to a recent CryptoQuant Quicktake post, Bitcoin (BTC) may be close to completing its price...
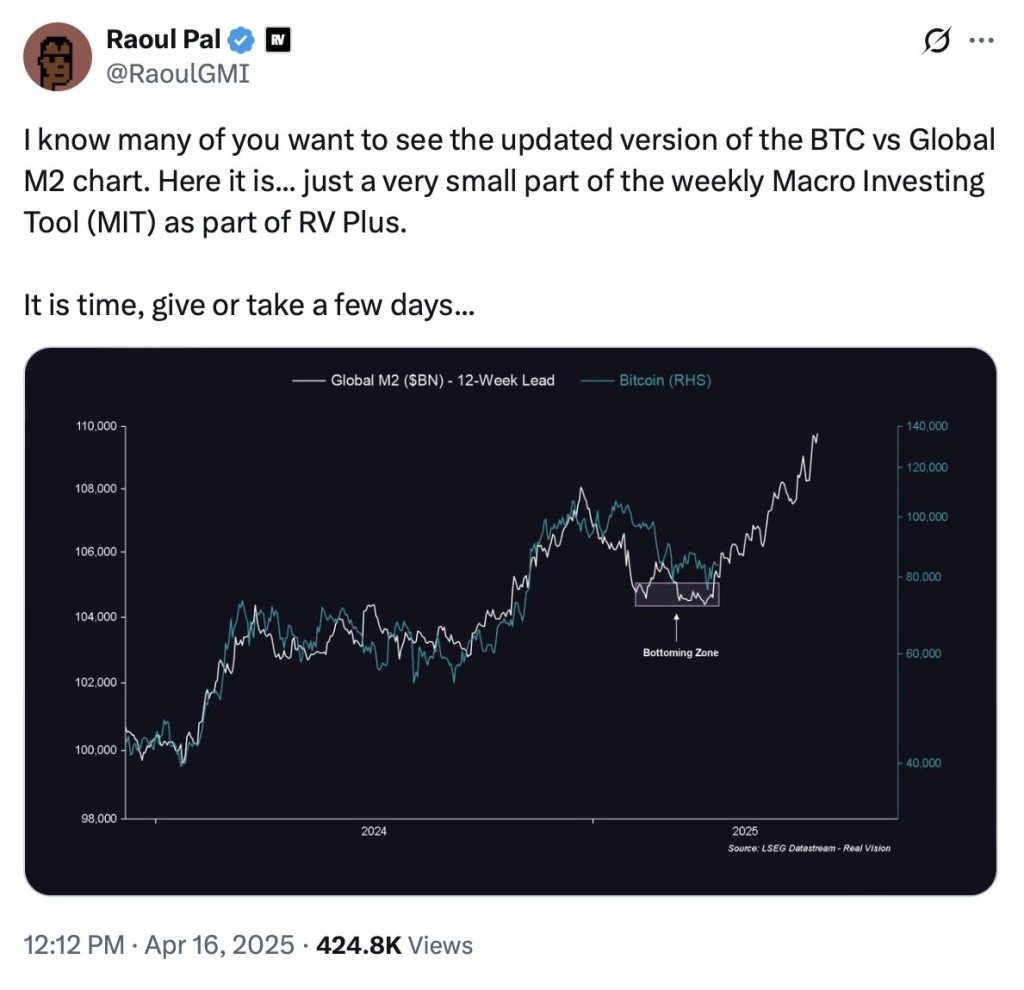
Crypto Gurus Predict Bitcoin Boom ‘In Days’—But Expert Urges Caution
A swirl of bullish proclamations is ricocheting across X as macro‑minded influencers argue that a fr...