Pudgy Penguins ($PENGU) Price Prediction: Can PENGU Reclaim $0.0062 After 44% Drop?


- Pudgy Penguins token drops 44% as NFT sales plunge 72% in 30 days.
- Trading activity remains strong despite falling prices and market cap decline.
- RSI and MACD indicators hint at a potential short-term rebound for $PENGU.
The Pudgy Penguins ($PENGU) token has seen a price correction this week as interest in its associated NFT collection continues to wane. The token fell to $0.0064, marking its lowest price since March 24 and a 13.5% drop from its weekly high.
Since reaching an all-time high, PENGU has now declined over 44%. This downturn has coincided with a marked decrease in Pudgy Penguins NFT sales, placing pressure on both the token and the general project’s momentum.
Sales Volume Drops 72% in 30 Days
According to data from CryptoSlam, Pudgy Penguins NFT sales have dropped by 72% over the last 30 days, falling to $8.15 million. This decline has moved the project to the 10th spot in NFT collection rankings by sales volume, a considerable fall from its previous top position.
NFT transaction rates have fallen towards a standstill as noticeable declines appear throughout leading projects. During the same timeframe, Bored Ape Yacht Club achieved $3.26 billion in lifetime sales, yet it registered at just $6 million during the period.
Despite the short-term decline, Pudgy Penguins remains among the top-performing collections overall, with cumulative NFT sales reaching $615 million across nearly 65,000 transactions.
Token Activity Remains High Despite Price Weakness
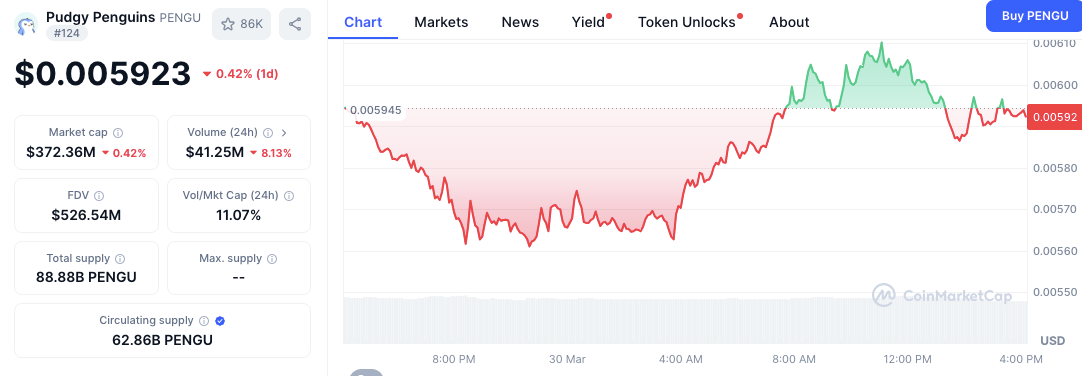
The current market value of $PENGU stands at $0.005923, which has decreased by 0.42% over the past day. Additionally, the trading volume of $PENGU has decreased by 8.13% to $41.25 million, while the market capitalization value is $372.36 million.

The token supply has a value of 88.88 billion while circulating tokens amount to 62.86 billion. Recent trading data shows ongoing market involvement through its 11.07% volume-to-market capitalization ratio during a 24-hour study period.
The price chart shows notable volatility between late March 29 and early March 30. After hitting a market low, a rebound began around 4:00 AM, pushing the price near $0.0061 by mid-morning. It has since remained around $0.0059, showing signs of short-term recovery.
Indicators Suggest Possible Rebound
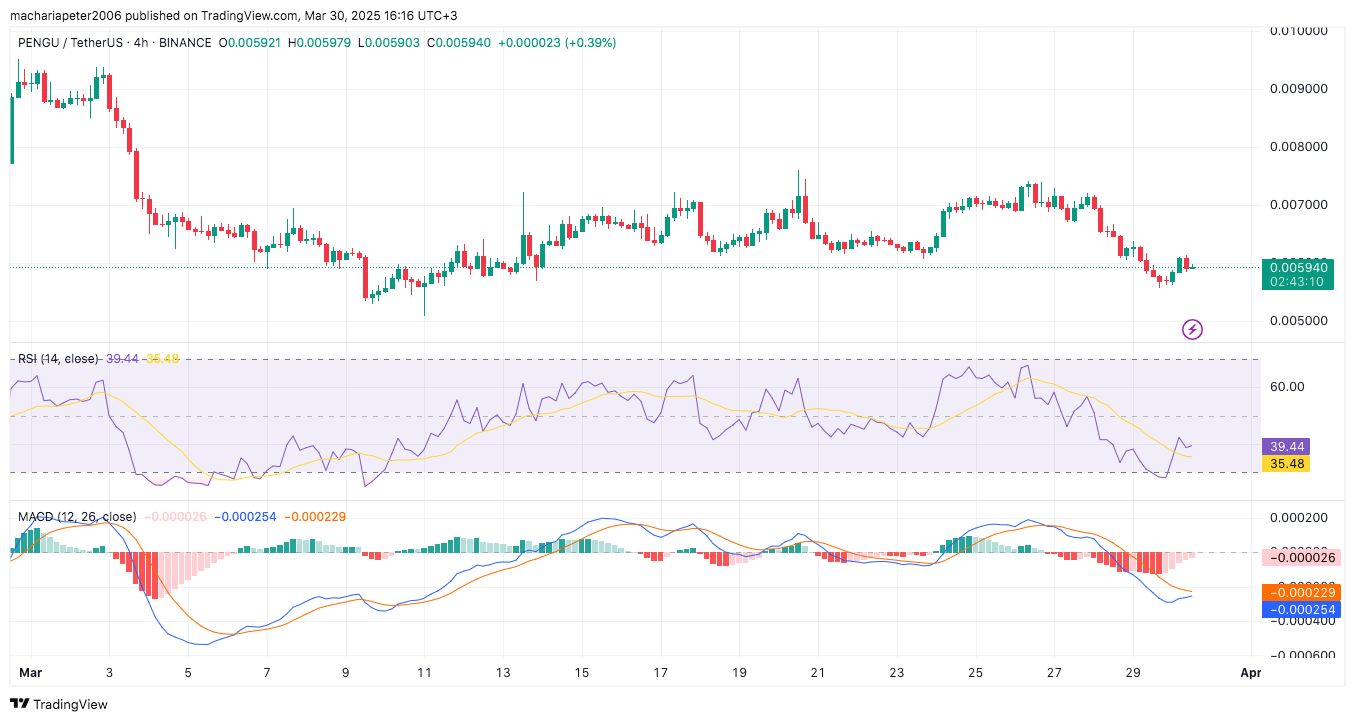
The technical indicators signal an upcoming trend reversal. The Relative Strength Index value of 39.44 indicates an upward market momentum since it has risen above its oversold level while approaching the neutral level of 50. The RSI moving average stands at 35.48, which indicates that initial buying signals are needed to emerge in the market.

The MACD indicator also shows a possible trend reversal. The MACD line, at -0.000254, is moving toward the signal line at -0.000229. The narrowing histogram bars signal weakened bearish momentum. The price reversal could gain credibility when the indicator crosses above its signal line. The support level stands at $0.0055, with projections indicating resistance will build at $0.0062.

Hacker Who Exploited zkLend to Drain $5.4M Falls Victim to Phishing Attack
The hacker lost funds to another hacker. In an attempt to obscure the tracks of the funds using Torn...

Top 5 Blockchain Press Release Distribution Platforms That Actually Understand the Tech
Discover the top 5 blockchain press release platforms that truly understand Web3 tech, ensuring your...

Bybit Leads Crypto Exchanges in March 2025 with $3.61 Billion in Capital Inflows
Bybit led all crypto exchanges (CEXs) in March 2025 with $3.61B in inflows and $14.9B in total value...

