Quant Price Prediction: Will QNT Price Break Its Consolidation?


The open, reliable, and secure internet that traditional systems promised is still not fully realized. However, distributed ledger technologies (DLTs), like blockchain, offer a way to finally achieve the internet’s original goal of becoming a truly decentralized network. These technologies have already started changing industries like finance and healthcare, showing their broad potential.
Despite the benefits, blockchain and other DLTs still face a major challenge: they’re not good at communicating with each other. Most decentralized applications currently run on a single blockchain because it’s difficult to make them work smoothly across different systems.
The Quant Network is working to solve this issue with a technology called Overledger. Overledger is an operating system designed to help blockchains communicate easily with each other. By doing this, it allows decentralized apps to operate seamlessly across multiple blockchains, making them more useful and flexible. Gilbert Verdian founded Quant Network in 2015 to make global information sharing more efficient. Quant created the Overledger DLT Gateway—also known as Enterprise 5—which allows different blockchains, such as Bitcoin, Ethereum, Hyperledger Fabric, R3 Corda, and BNB Chain, to easily communicate with one another. In this article, we’ll explore Quant price prediction with in-depth technical analysis and its future market sentiment.
Quant: A Quick Introduction
Gilbert Verdian founded Quant Network in 2015. In April 2018, the project successfully raised over $11 million through an initial coin offering (ICO).
Gilbert Verdian, CEO of Quant, also serves as Chair of the UK’s Blockchain and Distributed Ledger Technology committee. Additionally, he is involved with the EU Blockchain Observatory and has a role with the Federal Reserve.
Today, many organizations use blockchain networks built with different coding languages and development tools. These technical differences can make it difficult to transfer data between blockchains or connect them effectively. Quant’s solution, Overledger, is designed specifically to solve this problem by enabling easy communication between different blockchain platforms.
Current Quant Price Sentiment
| Current Price | $ 76.15 |
| Price Prediction | $ 73.14 (-3.62%) |
| Fear & Greed Index | 0 () |
| Sentiment | Bearish |
| Volatility | 9.97% |
| Green Days | 15/30 (50%) |
| 50-Day SMA | $ 86.67 |
| 200-Day SMA | $ 90.65 |
| 14-Day RSI | 40.24 |
All About QNT Crypto
The Quant Network uses its own cryptocurrency called QNT, an ERC-20 token originally built on Ethereum. Despite its Ethereum origin, QNT tokens are blockchain-agnostic, meaning they can easily move to other blockchain networks if needed. The token is classified by the Swiss Financial Market Supervisory Authority (FINMA) as a utility token, providing users with digital access to applications or services.
Developers need QNT tokens to build and operate applications on the Overledger platform. When developers buy licenses to use Quant’s services, they pay in regular fiat currency. The Quant Treasury then converts this fiat money into QNT tokens. This approach allows businesses to remain compliant without directly interacting with cryptocurrency exchanges.
Additionally, to perform read-and-write operations on Overledger, payments are also required in QNT tokens. These payments are priced in fiat currency, but again, the Quant Treasury handles converting fiat into QNT. Developers who monetize their applications can choose to charge subscriptions in QNT, fiat currency, or other digital currencies.
End users who want to access multiple decentralized applications (mDApps) within the Overledger ecosystem must also hold QNT tokens. For example, users are required to have QNT tokens to renew their annual license keys.
Quant: How Does It Work?
The Quant Network aims to solve the problem of blockchain interoperability using Overledger, an API gateway that connects multiple distributed ledger technologies (DLTs). An API (Application Programming Interface) is simply a tool that allows different computer programs to communicate with each other.
Overledger enables developers to build multi-chain decentralized applications, known as mDApps, which can operate seamlessly across several popular blockchains. To achieve this, Overledger is designed with four distinct layers:
Transaction Layer
This is where transactions confirmed by various blockchains are stored separately. Each ledger’s validated transactions are kept here, preventing duplicated confirmations on other chains. By grouping similar transactions in one place, Overledger simplifies the consensus process across different blockchain networks.
Messaging Layer
Unlike the Transaction Layer, where each blockchain maintains separate transaction records, the Messaging Layer serves as a shared communication channel. It gathers and standardizes transaction data from all individual ledgers—including details from smart contracts and message digests—into a common format. The Transaction Layer itself does not have visibility into this Messaging Layer, as transaction details are encapsulated, allowing seamless integration of data from various blockchains.
Filtering and Ordering Layer
This layer processes messages collected by the Messaging Layer, organizing and filtering them according to specific rules. It checks whether messages meet particular criteria set by applications, such as transferring a certain number of tokens or transactions involving specific blockchain addresses. Only messages that match these conditions move forward to the next layer.
Application Layer
This topmost layer manages interactions across all underlying layers. It defines rules and guidelines that mDApps use to communicate with blockchains and other applications. Each application running on Overledger is isolated, with its own set of mandatory and optional rules that dictate how it interacts with users, other applications, and the Overledger system itself.
Applications communicate by sending messages through the Messaging Layer. These messages are only delivered to another application’s Application Layer if they successfully pass through the Filtering and Ordering Layer, ensuring compliance with predefined application rules.
QNT Price Prediction: Price History
Quant launched into the crypto market with modest pricing, trading initially around $1 in 2018. It then surged to $2 in early 2019 and saw significant volatility even then—reaching highs near $6 in mid-2019 but quickly retracing, reflecting typical early-stage market fluctuations. Notably, June 2019 marked an extraordinary surge (+208%) from approximately $2.18 to over $6.72, which highlighted initial excitement and speculative trading.
The remainder of 2019 saw corrections, with the token falling to about $3.64 by December. Entering 2020, QNT dipped further during market corrections, touching lows near $1.15 in March, coinciding with the global financial crash due to the COVID-19 pandemic. However, from April 2020 onwards, the price gradually recovered, closing the year strong at approximately $11.42 by December.
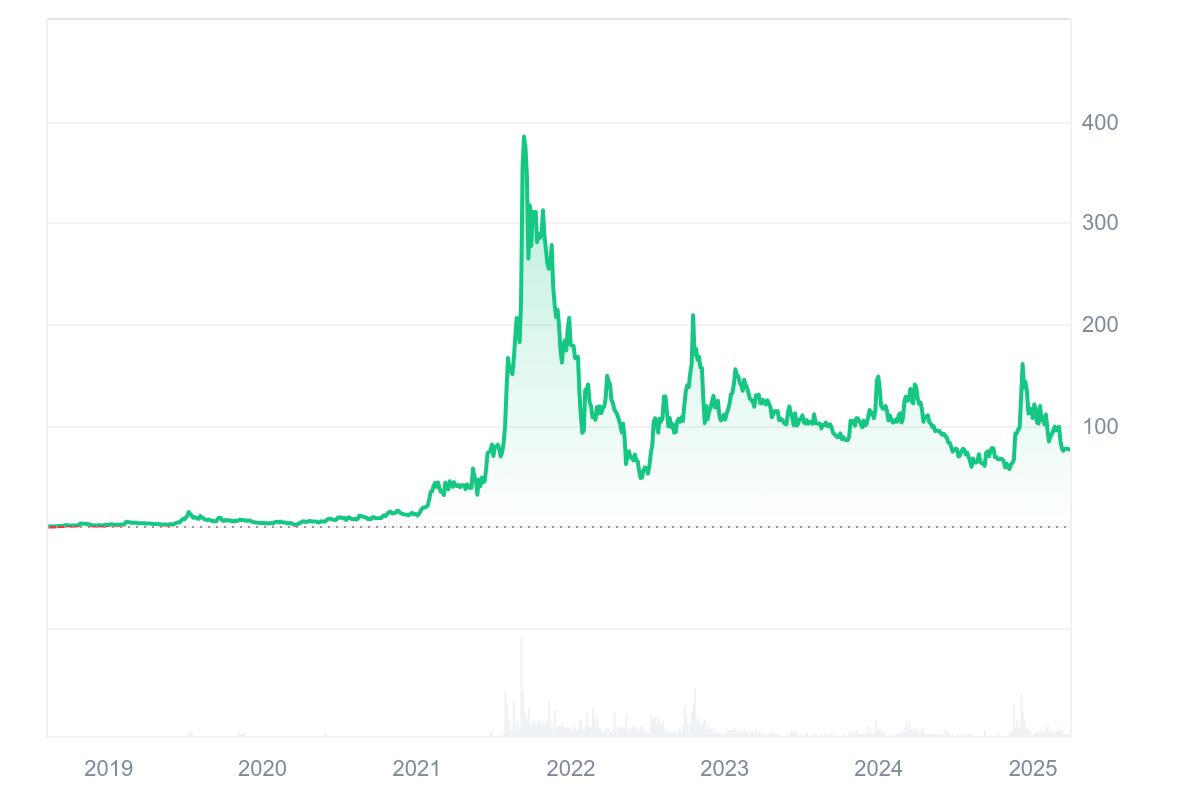
The year 2021 was great for Quant crypto. Riding the crypto bull market, QNT experienced explosive growth. Beginning the year at around $11.42, Quant surged dramatically, particularly notable in January 2021, with an impressive monthly gain of approximately 182%, pushing its price from about $11 to over $32.
Throughout mid-2021, the bullish momentum continued, eventually sending QNT to new heights. In September 2021, the token reached its all-time high of approximately $415.88, driven by increased adoption and optimism surrounding interoperability projects. This marked an incredible increase of about 463.8% within that month alone, reflecting peak investor demand.
However, this phase quickly gave way to heavy corrections. By November and December 2021, QNT experienced considerable pullbacks, closing the year at around $179.09, down from the highs due to profit-taking and overall market adjustments.
The following years saw Quant trading amid sustained volatility. Early 2022 started harshly, with Quant dropping significantly in January (-45.77%), driven partly by macroeconomic uncertainties affecting the entire crypto market. The year 2022 proved to be challenging for the crypto market, and Quant was no exception. Initially, QNT’s performance was relatively stable, but the landscape changed dramatically following the collapse of the Terra (LUNA) blockchain, which had a ripple effect across the market.
Subsequent events, including the bankruptcy of the FTX (FTT) exchange, further dampened any chances of recovery for QNT.
Prices fluctuated throughout 2022, highlighted by dramatic swings, such as the July spike (+91.32%), pushing from about $53 to around $102, followed by sharp retracements in the following months.
October 2022 witnessed another notable peak, with Quant reaching approximately $227 before retracing sharply again, closing the year lower at about $105.40. Throughout 2023, QNT’s volatility continued, trading largely within the $90–$130 range.
Quant’s price history over 2024 continued reflecting significant volatility. Starting at about $102.63 in January 2024, it experienced fluctuations between roughly $68 and $149.39. March 2024 saw a notable recovery (+15.09%) pushing QNT above $130. However, the momentum was short-lived, and subsequent months saw persistent declines and occasional recoveries.
Late 2024 and early 2025 showed even sharper price movements. Notably, November 2024 recorded an impressive surge (+67.94%) pushing QNT from about $59.10 to nearly $99.26. This was due to Donald Trump’s victory in the elections. However, the gains weren’t sustained, as QNT again pulled back sharply. By March 2025, Quant was trading around $77.07, marking a significant monthly drop of over 20% due to Trump’s increased tariffs.
Quant Oscillators
| Period | Value | Action |
| RSI (14) | 40.24 | NEUTRAL |
| Stoch RSI (14) | 55.28 | NEUTRAL |
| Stochastic Fast (14) | 47.02 | NEUTRAL |
| Commodity Channel Index (20) | 66.67 | NEUTRAL |
| Average Directional Index (14) | 21.91 | NEUTRAL |
| Awesome Oscillator (5, 34) | -6.33 | NEUTRAL |
| Momentum (10) | -0.36 | SELL |
| MACD (12, 26) | 0.73 | NEUTRAL |
| Williams Percent Range (14) | -52.98 | NEUTRAL |
| Ultimate Oscillator (7, 14, 28) | 41.24 | NEUTRAL |
| VWMA (10) | 77.9 | SELL |
| Hull Moving Average (9) | 77.8 | SELL |
| Ichimoku Cloud B/L (9, 26, 52, 26) | 84.05 | NEUTRAL |
Quant Price Prediction: Technical Analysis
Quant recently experienced strong downward momentum, breaking below crucial Fibonacci levels to decline toward $76. Currently trading around $76, QNT has dipped approximately 1.2% over the past 24 hours.
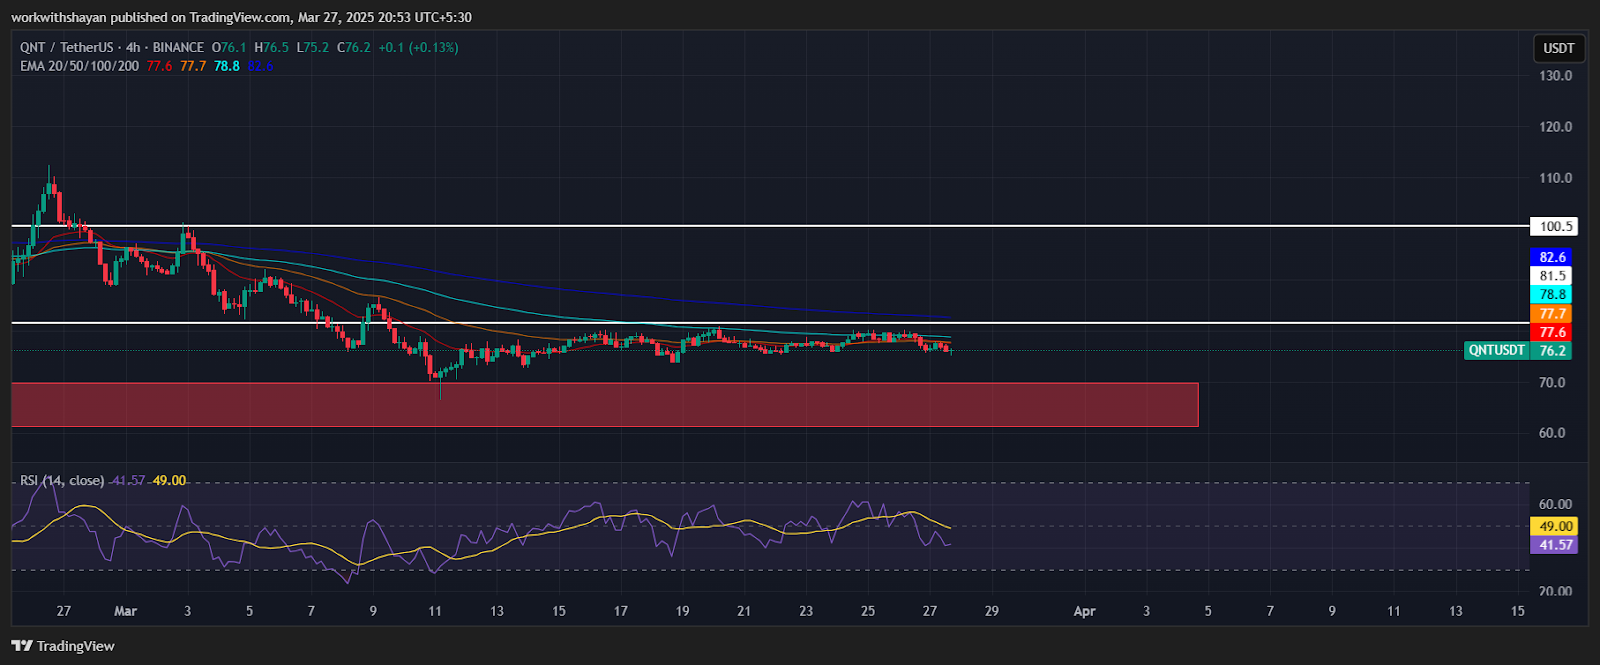
Sellers remain active, determined to hold QNT below the critical $81 resistance. Nevertheless, buyers are maintaining pressure, preparing for another push to reclaim this important level.
If bullish momentum strengthens and QNT successfully breaks above $81, investor confidence could rise, potentially paving the way toward the next major target at $100.
However, if the bulls falter at this key resistance, QNT risks further downside pressure, possibly retreating toward the support range between $70 and $61.
QNT Price Predictions by Blockchain Reporter
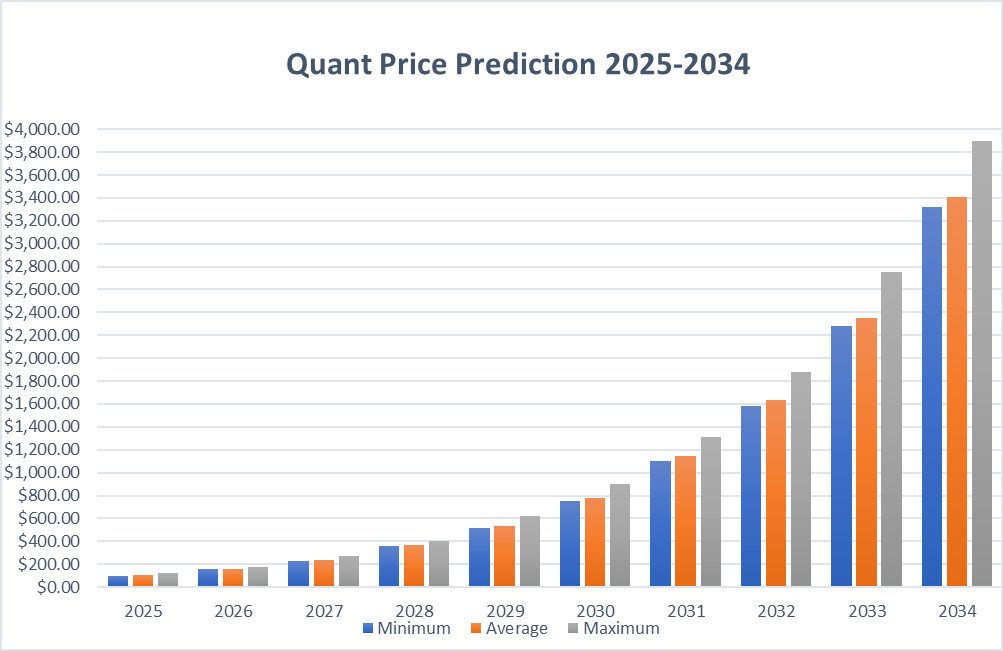
| Years | Minimum ($) | Average ($) | Maximum ($) |
| 2025 | $101.28 | $105.16 | $120.35 |
| 2026 | $157.75 | $161.95 | $179.08 |
| 2027 | $227.20 | $235.30 | $270.00 |
| 2028 | $357.71 | $369.48 | $401.17 |
| 2029 | $518.39 | $536.86 | $620.63 |
| 2030 | $753.16 | $780.01 | $900.24 |
| 2031 | $1,105 | $1,144 | $1,310 |
| 2032 | $1,585 | $1,631 | $1,883 |
| 2033 | $2,282 | $2,347 | $2,755 |
| 2034 | $3,316 | $3,410 | $3,893 |
Quant Price Prediction 2025
In 2025, Quant (QNT) is expected to trade between a minimum price of $101.28 and a maximum price of $120.35. The average predicted price for QNT throughout the year is around $105.16, indicating moderate growth and steady investor confidence.
| Months | Minimum ($) | Average ($) | Maximum ($) |
| January | 89.2 | 92.5 | 96.4 |
| February | 90.5 | 93.4 | 97.5 |
| March | 91.8 | 94.6 | 99.2 |
| April | 93.1 | 95.7 | 100.5 |
| May | 94.5 | 97.1 | 102.2 |
| June | 95.8 | 98.5 | 104.1 |
| July | 97.1 | 99.8 | 106.5 |
| August | 98.5 | 101.2 | 109 |
| September | 99.2 | 102.7 | 111.4 |
| October | 100 | 103.6 | 114.5 |
| November | 100.7 | 104.4 | 117.5 |
| December | 101.28 | 105.16 | 120.35 |
Quant Price Prediction 2026
For 2026, the price of Quant is projected to rise significantly, with a minimum expected level of $157.75 and a potential maximum of $179.08. The average trading price throughout the year could be approximately $161.95, highlighting growing market optimism for QNT.
| Months | Minimum ($) | Average ($) | Maximum ($) |
| January | $99.90 | $110.42 | $113.57 |
| February | $110.63 | $114.83 | $119.09 |
| March | $111.87 | $117.13 | $124.84 |
| April | $116.56 | $121.82 | $129.52 |
| May | $121.26 | $125.47 | $135.61 |
| June | $123.98 | $129.24 | $140.63 |
| July | $129.15 | $134.40 | $145.80 |
| August | $135.57 | $139.78 | $151.18 |
| September | $138.72 | $143.97 | $158.17 |
| October | $144.48 | $149.73 | $165.36 |
| November | $150.46 | $155.72 | $172.85 |
| December | $157.75 | $161.95 | $179.08 |
Quant Price Prediction 2027
By 2027, technical analysis suggests Quant could reach even higher levels. Predictions place its minimum value around $227.20, with a maximum potential value of approximately $270.00. The average trading price throughout 2027 is forecasted to be about $235.30, driven by increased adoption and technological advancements.
| Months | Minimum ($) | Average ($) | Maximum ($) |
| January | $155.47 | $170.05 | $174.91 |
| February | $170.37 | $176.85 | $181.71 |
| March | $174.06 | $182.16 | $188.78 |
| April | $181.14 | $187.62 | $196.07 |
| May | $184.90 | $191.37 | $205.45 |
| June | $188.72 | $195.20 | $215.02 |
| July | $192.63 | $199.11 | $222.83 |
| August | $200.59 | $207.07 | $232.78 |
| September | $207.25 | $215.35 | $241.07 |
| October | $213.72 | $221.81 | $249.68 |
| November | $222.59 | $230.69 | $260.77 |
| December | $227.20 | $235.30 | $270.00 |
Quant Price Prediction 2028
Quant is expected to continue its upward momentum in 2028, reaching at least $357.71. Forecasts suggest the crypto asset could achieve a maximum price of $401.17, with an average annual price around $369.48. This indicates strong long-term potential as the market matures.
| Months | Minimum ($) | Average ($) | Maximum ($) |
| January | $225.89 | $247.06 | $254.12 |
| February | $247.53 | $256.95 | $266.48 |
| March | $257.81 | $267.22 | $279.32 |
| April | $266.15 | $277.91 | $292.68 |
| May | $277.27 | $289.03 | $303.80 |
| June | $288.83 | $300.59 | $315.36 |
| July | $303.20 | $312.61 | $327.39 |
| August | $313.35 | $325.12 | $339.89 |
| September | $325.46 | $334.87 | $356.15 |
| October | $336.50 | $348.27 | $372.89 |
| November | $346.95 | $358.72 | $386.82 |
| December | $357.71 | $369.48 | $401.17 |
Quant Price Prediction 2029
Quant’s price growth is anticipated to accelerate further in 2029. The token is predicted to trade at a minimum level of $518.39, with a maximum price potentially reaching $620.63. The average price forecast for the year stands at $536.86, reflecting sustained confidence among investors.
| Months | Minimum ($) | Average ($) | Maximum ($) |
| January | $354.70 | $387.95 | $399.04 |
| February | $377.24 | $395.71 | $414.55 |
| March | $393.07 | $411.54 | $430.38 |
| April | $409.11 | $423.89 | $446.84 |
| May | $418.13 | $436.60 | $468.04 |
| June | $431.23 | $449.70 | $489.87 |
| July | $444.72 | $463.19 | $507.86 |
| August | $457.68 | $472.45 | $526.38 |
| September | $472.88 | $491.35 | $550.01 |
| October | $491.31 | $506.09 | $574.57 |
| November | $501.44 | $516.22 | $594.82 |
| December | $518.39 | $536.86 | $620.63 |
Quant Price Prediction 2030
In 2030, the Quant price could see substantial appreciation, with minimum expected values around $753.16 and a possible peak price at $900.24. Throughout the year, the average trading price is expected to hover around $780.01, indicating a robust market position.
| Months | Minimum ($) | Average ($) | Maximum ($) |
| January | $510.02 | $563.71 | $579.81 |
| February | $548.14 | $574.98 | $602.36 |
| March | $559.64 | $586.48 | $631.11 |
| April | $582.60 | $604.08 | $654.57 |
| May | $606.76 | $628.24 | $684.77 |
| June | $625.61 | $647.09 | $716.19 |
| July | $651.49 | $672.97 | $742.07 |
| August | $673.04 | $699.89 | $768.99 |
| September | $692.41 | $713.89 | $796.98 |
| October | $715.60 | $742.44 | $832.68 |
| November | $735.81 | $757.29 | $862.37 |
| December | $753.16 | $780.01 | $900.24 |
Quant Price Prediction 2031
Forecasts for 2031 suggest Quant’s value could break above the $1,000 mark. The minimum price predicted is $1,105, with potential to reach a maximum of $1,310. The average projected trading price for QNT during this year is around $1,144, underlining significant long-term investor optimism.
| Months | Minimum ($) | Average ($) | Maximum ($) |
| January | $748.81 | $819.01 | $842.41 |
| February | $820.57 | $851.77 | $883.36 |
| March | $846.84 | $885.84 | $925.95 |
| April | $872.36 | $903.56 | $970.24 |
| May | $891.66 | $930.66 | $1,015 |
| June | $927.38 | $958.58 | $1,062 |
| July | $957.93 | $996.93 | $1,100 |
| August | $977.86 | $1,017 | $1,140 |
| September | $1,008 | $1,047 | $1,181 |
| October | $1,048 | $1,079 | $1,223 |
| November | $1,061 | $1,100 | $1,266 |
| December | $1,105 | $1,144 | $1,310 |
Quant Price Prediction 2032
By 2032, Quant could experience further substantial growth, trading at a minimum of $1,585 and potentially peaking at $1,883. The expected average price throughout the year is approximately $1,631, reflecting strong growth driven by increasing utility and blockchain adoption.
| Months | Minimum ($) | Average ($) | Maximum ($) |
| January | $1,087 | $1,202 | $1,236 |
| February | $1,168 | $1,226 | $1,296 |
| March | $1,205 | $1,262 | $1,345 |
| April | $1,243 | $1,300 | $1,396 |
| May | $1,282 | $1,339 | $1,448 |
| June | $1,322 | $1,379 | $1,501 |
| July | $1,350 | $1,407 | $1,556 |
| August | $1,406 | $1,463 | $1,627 |
| September | $1,447 | $1,493 | $1,685 |
| October | $1,465 | $1,522 | $1,760 |
| November | $1,522 | $1,568 | $1,821 |
| December | $1,585 | $1,631 | $1,883 |
Quant Price Prediction 2033
In 2033, Quant’s price is forecasted to reach a minimum value of around $2,282, with the possibility of reaching a maximum price of $2,755. Throughout the year, the average price is anticipated to be approximately $2,347, demonstrating continued bullish expectations from investors.
| Months | Minimum ($) | Average ($) | Maximum ($) |
| January | $1,549 | $1,712 | $1,761 |
| February | $1,665 | $1,747 | $1,830 |
| March | $1,735 | $1,817 | $1,917 |
| April | $1,789 | $1,871 | $2,008 |
| May | $1,862 | $1,927 | $2,102 |
| June | $1,923 | $2,004 | $2,179 |
| July | $1,979 | $2,044 | $2,279 |
| August | $2,024 | $2,106 | $2,361 |
| September | $2,087 | $2,169 | $2,466 |
| October | $2,147 | $2,212 | $2,553 |
| November | $2,197 | $2,279 | $2,641 |
| December | $2,282 | $2,347 | $2,755 |
Quant Price Prediction 2034
Looking ahead to 2034, Quant’s growth is projected to continue significantly, reaching a minimum level of around $3,316. Forecasts suggest a potential maximum price of $3,893, with an average trading value for the year estimated at about $3,410, indicating a very bullish long-term outlook for Quant investors.
| Months | Minimum ($) | Average ($) | Maximum ($) |
| January | $2,230 | $2,464 | $2,535 |
| February | $2,469 | $2,563 | $2,658 |
| March | $2,497 | $2,614 | $2,786 |
| April | $2,549 | $2,666 | $2,917 |
| May | $2,652 | $2,746 | $3,050 |
| June | $2,684 | $2,801 | $3,160 |
| July | $2,768 | $2,885 | $3,272 |
| August | $2,907 | $3,001 | $3,387 |
| September | $2,973 | $3,091 | $3,507 |
| October | $3,120 | $3,214 | $3,631 |
| November | $3,249 | $3,343 | $3,760 |
| December | $3,316 | $3,410 | $3,893 |
Quant Price Forecasts: By Experts
According to Coincodex’s current Quant price prediction, the price of Quant is expected to decrease by -3.62%, reaching approximately $74.74 by April 26, 2025. Coincodex’s technical indicators suggest a bearish market sentiment, with the Fear & Greed Index currently at 0, indicating extreme fear. Quant has experienced 15 out of the last 30 days (50%) as positive trading days, with a price volatility of 9.97% during this period. Based on Coincodex’s forecast, the current conditions indicate that it may be an unfavorable time to purchase Quant.
According to Digital Coin Price, market analysts and experts forecast that Quant (QNT) will begin 2027 at approximately $224.93 and could reach around $272.80 by the end of the year. These projections represent a significant increase compared to the previous year, reflecting substantial growth potential for Quant.
Looking further ahead, Digital Coin Price estimates that by 2033, Quant’s price could reach a minimum of $1,048.77. The average trading price throughout 2033 is predicted to be about $1,079.63, with the maximum potential price forecasted around $1,096.66, indicating continued optimism among specialists regarding Quant’s long-term value.
Is Quant a Good Investment? When to Buy?
Quant Network offers unique features, such as enabling developers to create decentralized apps (mDApps), connecting different blockchain technologies, and supporting multiple programming languages. These aspects make Quant an appealing blockchain project.
However, since many other companies are also working on blockchain interoperability, investors should thoroughly research and compare all available projects before deciding to invest. It can also be beneficial to closely examine Quant’s features and practical use cases to better understand its future potential. Additionally, clearly defining personal financial goals and considering portfolio diversification are essential when investing in the volatile cryptocurrency market.
According to Blockchain Reporter’s technical analysis of the QNT crypto, it is advised to invest in Quant at a price of $65 for a profitable return in the long term.
Conclusion
Quant’s Overledger platform requires businesses to pay licensing fees using QNT tokens, which could encourage these enterprises to buy Quant Network’s cryptocurrency to cover their costs. Additionally, investors and companies interested in a standardized API that enables easy connection to multiple blockchain networks may also find QNT appealing.
Moreover, Quant’s ability to enable communication between private and public blockchains positions it as a useful framework for creating central bank digital currencies (CBDCs). For example, the Quant team supports the Digital Pound Foundation’s vision of designing a robust CBDC, such as a digital pound (“Britcoin”), to ensure interoperability between current and future global payment systems and traditional payment methods, including electronic money and cash.
But is the Quant network secure? While there’s no absolute guarantee, the likelihood of a security breach on Quant’s network is extremely low, as it cannot be forked or disconnected from the many blockchain ledgers it integrates.
Frequently Asked Questions (FAQ):
What is Quant (QNT)?
Quant is a blockchain project focused on interoperability across different distributed ledger technologies (DLTs). It allows seamless communication between various blockchains through its proprietary Overledger operating system.
What is the purpose of QNT tokens?
QNT is an ERC-20 utility token used to access services within the Overledger ecosystem. It is required for license renewals, developer access, API interactions, and operating decentralized multi-chain applications (mDApps).
What is Overledger?
Overledger is Quant’s interoperability platform that enables multiple blockchains to interact efficiently. It consists of four layers: Transaction, Messaging, Filtering & Ordering, and Application—designed to allow decentralized apps to work across several blockchain networks.
Why is Quant important for blockchain interoperability?
Quant solves one of the blockchain industry’s biggest problems: lack of communication between different blockchains. With Overledger, developers can create applications that work across Ethereum, Bitcoin, BNB Chain, Hyperledger, and more.
What is Quant’s all-time high price?
Quant reached its all-time high of approximately $415.88 in September 2021 during the peak of the crypto bull market.
What is the short-term price prediction for QNT in 2025?
QNT is expected to range between $101.28 and $120.35 in 2025, with an average forecast of $105.16 , based on Blockchain Reporter’s data.
What are the long-term price predictions for Quant?
Quant’s price forecast suggests steady growth:
- 2026: Avg. $161.95
- 2027: Avg. $235.30
- 2030: Avg. $780.01
- 2033: Avg. $2,347
- 2034: Up to $3,893 (maximum)
What factors influence Quant’s price?
QNT’s price is influenced by:
- Interoperability demand
- Institutional adoption
- Regulatory developments
- Broader crypto market sentiment
- Token supply and treasury management
Can Quant be used in CBDCs?
Yes. Quant is actively supporting central bank digital currency (CBDC) projects, such as the UK’s Digital Pound Foundation, providing secure and interoperable infrastructure.
Is the Quant network secure?
Quant is highly secure. Its Overledger protocol cannot be forked or separated from connected blockchains, reducing the risk of a network breach.

SHIB Price Prediction for March 31: Will Shrinking Bearish Momentum Lead to a Breakout?
Shiba Inu shows signs of recovery as $SHIB trades at $0.00001251, volume jumps 38.6%, and RSI, MACD ...

Solana Price Prediction for March 31: Can SOL Break Above $130 After 40% Annual Drop?
Solana ($SOL) trades at $124.34 after a 40% annual drop, with RSI and MACD showing weak recovery sig...

Ambient Unveils Revolutionary AI-Powered Proof-of-Work Blockchain with $7.2M Seed Funding
Ambient emerges from stealth mode with $7.2M seed funding from a16z CSX, pioneering a PoW AI blockch...

