Bitcoin Ongoing Recovery: a Bull Trap or Breakout? Market Index Reveals Crucial Clues


Bitcoin has maintained its upward trajectory so far this week, with the asset reclaiming and holding above the $85,000 mark. This performance reflects a weekly gain of approximately 4.7%, indicating a possible shift in momentum after weeks of sideways and bearish activity.
While short-term gains have been recorded, signs that might determine Bitcoin’s next major move appear to have emerged. Particularly, a r enewed analysis of market health and investor behavior has accompanied the current price action of BTC.
On-chain metrics and sentiment indicators are being used to assess whether the current recovery signals a continuation of the bull cycle or if the market may be transitioning into a new phase .
One such framework recently shared by CryptoQuant contributor Woominkyu offers a broader view of Bitcoin’s positioning using the Bitcoin Combined Market Index (BCMI).
Assessing Market Health Through BCMI Metrics
According to Woominkyu, the BCMI provides a comprehensive overview of Bitcoin’s market condition by aggregating four core metrics: MVRV (30%), NUPL (25%), SOPR (25%), and the Fear & Greed Index (20%).

Each component reflects key aspects of network valuation, investor sentiment, realized gains/losses, and emotional market trends. The index assigns weightings to each metric and calculates a combined score, which can indicate whether the market is overheated or undervalued .
Historically, a BCMI score below 0.15 is associated with extreme fear and potential buying opportunities, while scores above 0.75 often precede market tops or sharp corrections.
At present, the BCMI remains below the 0.5 level, suggesting that Bitcoin has not yet entered the overheated zone. Woominkyu suggests two possible scenarios : the market is either undergoing a normal correction within an ongoing bull cycle, or it is showing early signs of an atypical transition into a bearish phase.
The moment of decision for Bitcoin
“During this current market cycle, BCMI hasn’t yet reached the typical ‘overheated’ zone (above 0.75). It’s currently hovering below 0.5, suggesting we’re at a crucial market juncture.” – By @Woo_Minkyu
Read more
https://t.co/sfyunRuWbh pic.twitter.com/he77VS98t7
— CryptoQuant.com (@cryptoquant_com) March 26, 2025
Key Thresholds to Watch in Bitcoin
The analyst points to the importance of monitoring the 7-day and 90-day moving averages of the BCMI for clearer direction.
Should the index begin to trend upward, it may signal renewed momentum and a potential return to higher price levels. Conversely, a sustained decline could confirm a broader trend reversal . Meanwhile, IntoTheBlock has recently shared resistance zones of BTC identified onchain.
The market intelligence platform particularly emphasizes the $97.400 level noting that this is “where roughly 1.44 million BTC are currently holding at a loss,” therefore should BTC price hit that point we could see a pullback .
Is Bitcoin on its way to test its highs?
The red bubbles in this chart highlight levels where underwater investors could sell as they break even, especially if uncertainty persists.
A key zone is around $97.4k, where roughly 1.44 million BTC are currently holding at a loss. pic.twitter.com/LKaDBen7cU
— IntoTheBlock (@intotheblock) March 24, 2025
Featured image created with DALL-E, Chart from TradingViiew
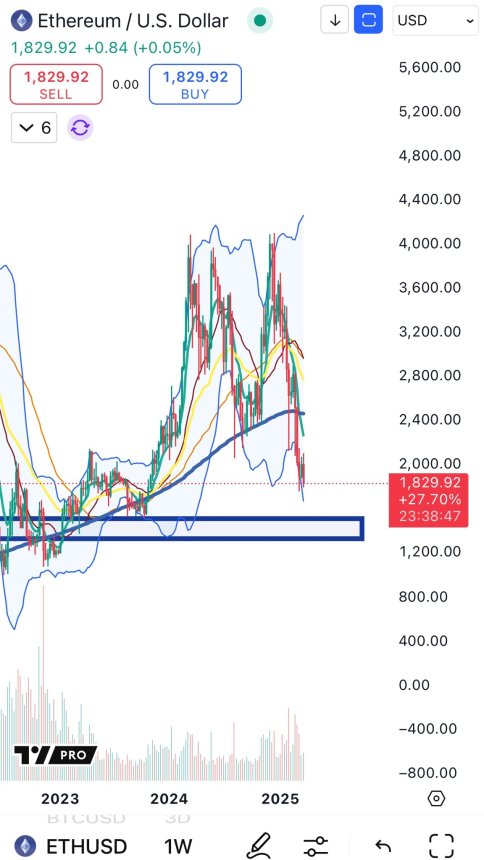
Ethereum Analyst Eyes $1,200-$1,300 Level As Potential Acquisition Zone – Details
Ethereum is facing mounting pressure after weeks of relentless selling and underwhelming price actio...
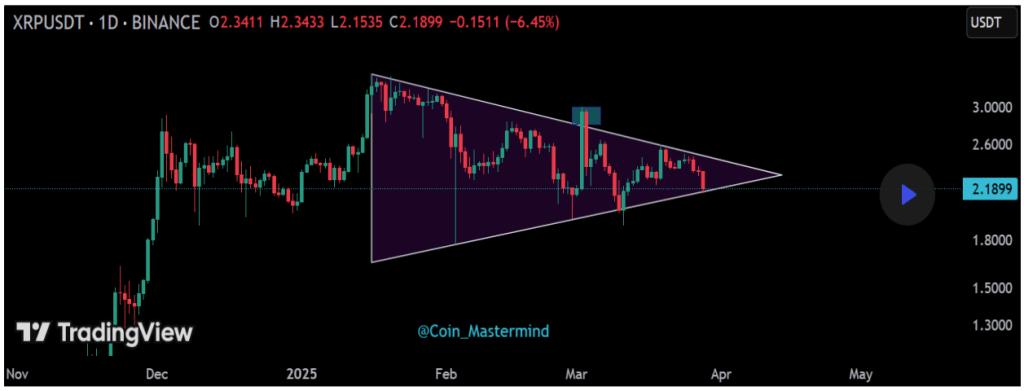
XRP On The Edge: Will Support Hold Or Unleash A Breakdown?
XRP has been on a consistent downward trend since the beginning of the just concluded week. A steady...
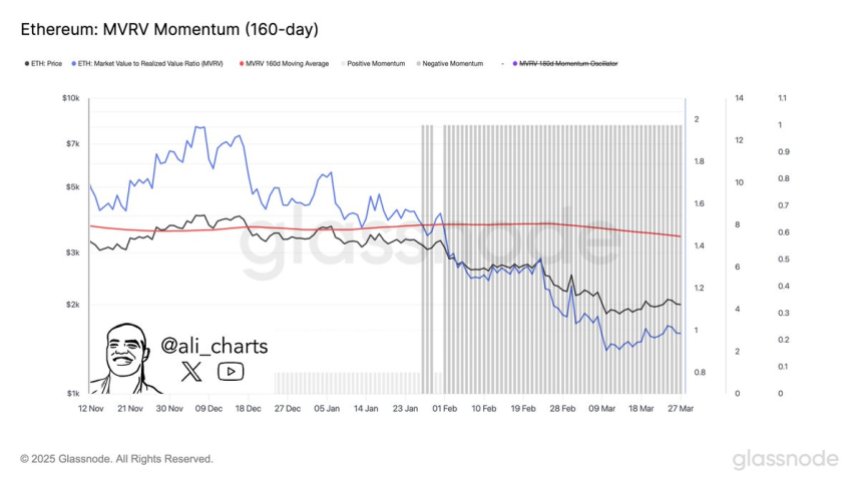
Ethereum MVRV Ratio Nears 160-Day MA Crossover – Accumulation Trend Ahead?
Ethereum is once again under heavy selling pressure after losing the critical $2,000 level — a psych...