XRP Price Rejected at Resistance—Are Bears Taking Control?


XRP price started a fresh decline from the $2.50 resistance zone. The price is now recovering and might face resistance near the $2.42 level.
- XRP price started a fresh decline after it failed to clear the $2.50 resistance zone.
- The price is now trading below $2.420 and the 100-hourly Simple Moving Average.
- There was a break below a connecting bullish trend line with support at $2.440 on the hourly chart of the XRP/USD pair (data source from Kraken).
- The pair might extend losses if it breaks the $2.350 support zone.
XRP Price Dips Again
XRP price failed to continue higher above the $2.50 resistance zone and reacted to the downside, like Bitcoin and Ethereum . The price declined below the $2.42 and $2.40 levels.
There was a break below a connecting bullish trend line with support at $2.440 on the hourly chart of the XRP/USD pair. The pair even spiked below $2.35. A low was formed at $2.329 and the price is now recovering some losses. There was a move above $2.38.
The price surpassed the 23.6% Fib retracement level of the recent decline from the $2.478 swing high to the $2.329 low. The price is now trading below $2.40 and the 100-hourly Simple Moving Average.
On the upside, the price might face resistance near the $2.40 level and the 50% Fib retracement level of the recent decline from the $2.478 swing high to the $2.329 low. The first major resistance is near the $2.420 level. The next resistance is $2.450.
A clear move above the $2.450 resistance might send the price toward the $2.50 resistance. Any more gains might send the price toward the $2.620 resistance or even $2.6650 in the near term. The next major hurdle for the bulls might be $2.80.
More Losses?
If XRP fails to clear the $2.420 resistance zone, it could start another decline. Initial support on the downside is near the $2.350 level or the trend line. The next major support is near the $2.320 level.
If there is a downside break and a close below the $2.320 level, the price might continue to decline toward the $2.20 support. The next major support sits near the $2.150 zone.
Technical Indicators
Hourly MACD – The MACD for XRP/USD is now losing pace in the bearish zone.
Hourly RSI (Relative Strength Index) – The RSI for XRP/USD is now below the 50 level.
Major Support Levels – $2.350 and $2.320.
Major Resistance Levels – $2.420 and $2.450.

Bitcoin Spot ETFs See $197 Million Net Inflows As Q1 Closes – Details
By their lofty standards, the US Bitcoin spot ETFs produced a moderately positive performance last w...
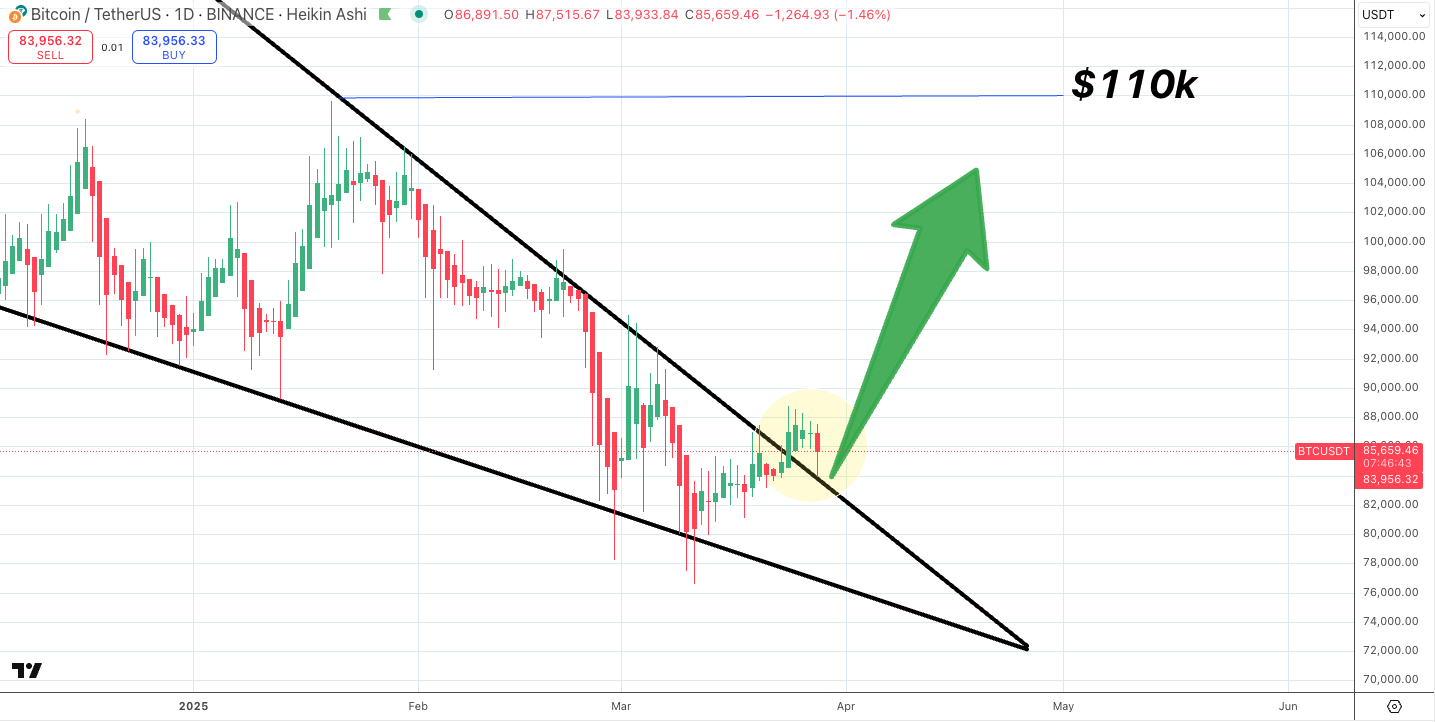
Bitcoin Breaks Falling Wedge – Is $110,000 The Next Stop?
A popular market analyst with X username Satoshi Flipper has predicted that Bitcoin could experience...
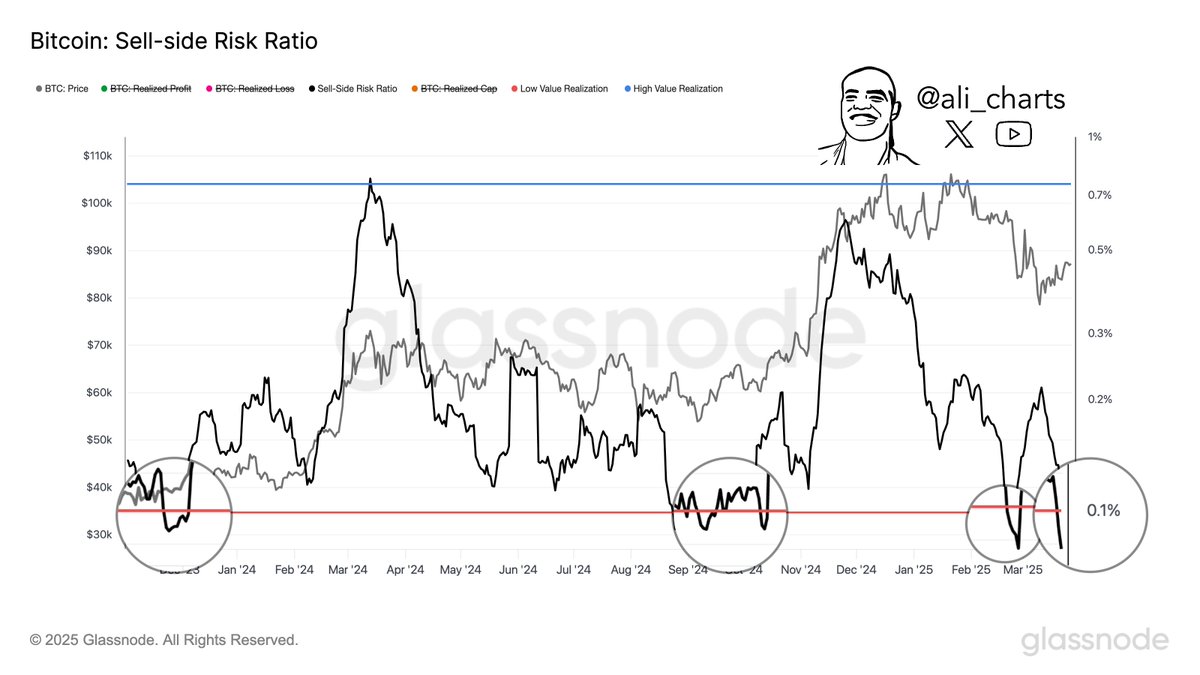
Bitcoin Sell-Side Risk Ratio Just Dropped Under This Critical Level — What Next For BTC Price?
The price action of Bitcoin has been largely underwhelming on almost every weekend so far in 2025. A...