XRP Price Consolidates—Breakout Incoming or More Choppy Moves?


XRP price started a fresh recovery wave above the $2.40 zone. The price is now correcting gains from $2.50 and might revisit the $2.35 support.
- XRP price started a fresh recovery wave above the $2.40 resistance zone.
- The price is now trading above $2.40 and the 100-hourly Simple Moving Average.
- There was a break below a connecting bullish trend line with support at $2.430 on the hourly chart of the XRP/USD pair (data source from Kraken).
- The pair might extend losses if it breaks the $2.40 support zone.
XRP Price Trims Gains
XRP price remained supported and started a recovery wave above the $2.320 zone, like Bitcoin and Ethereum . The price was able to clear the $2.40 and $2.420 resistance levels.
The bulls were able to push the price above the 50% Fib retracement level of the downward wave from the $2.580 swing high to the $2.354 low. The price even tested the $2.50 resistance. However, there was no upside continuation and the price reacted to the downside.
There was a break below a connecting bullish trend line with support at $2.430 on the hourly chart of the XRP/USD pair. The price is now trading above $2.40 and the 100-hourly Simple Moving Average.
On the upside, the price might face resistance near the $2.450 level. The first major resistance is near the $2.480 level. The next resistance is $2.50 or the 61.8% Fib retracement level of the downward wave from the $2.580 swing high to the $2.354 low.
A clear move above the $2.50 resistance might send the price toward the $2.550 resistance. Any more gains might send the price toward the $2.650 resistance or even $2.6650 in the near term. The next major hurdle for the bulls might be $2.80.
More Losses?
If XRP fails to clear the $2.480 resistance zone, it could start another decline. Initial support on the downside is near the $2.40 level. The next major support is near the $2.350 level.
If there is a downside break and a close below the $2.350 level, the price might continue to decline toward the $2.320 support. The next major support sits near the $2.250 zone.
Technical Indicators
Hourly MACD – The MACD for XRP/USD is now losing pace in the bullish zone.
Hourly RSI (Relative Strength Index) – The RSI for XRP/USD is now below the 50 level.
Major Support Levels – $2.40 and $2.350.
Major Resistance Levels – $2.480 and $2.50.

Binance Wallet Scandal – Employee Caught Insider Trading. Here’s Why Investors Are Backing Best Wallet Token
A whistleblower at Binance has revealed details of insider trading and front-running by an internal ...
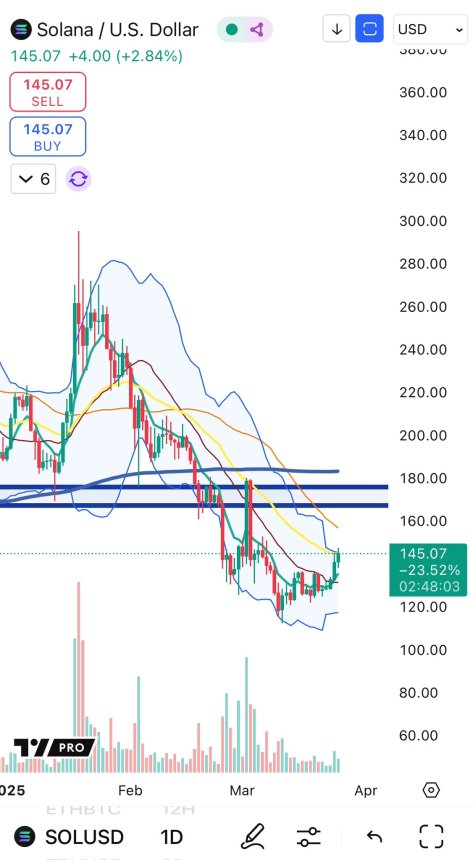
Solana Tags Upper Bollinger Band For First Time Since ATH — Is Momentum Returning?
Solana (SOL) is showing early signs of recovery after enduring several days of selling pressure and ...
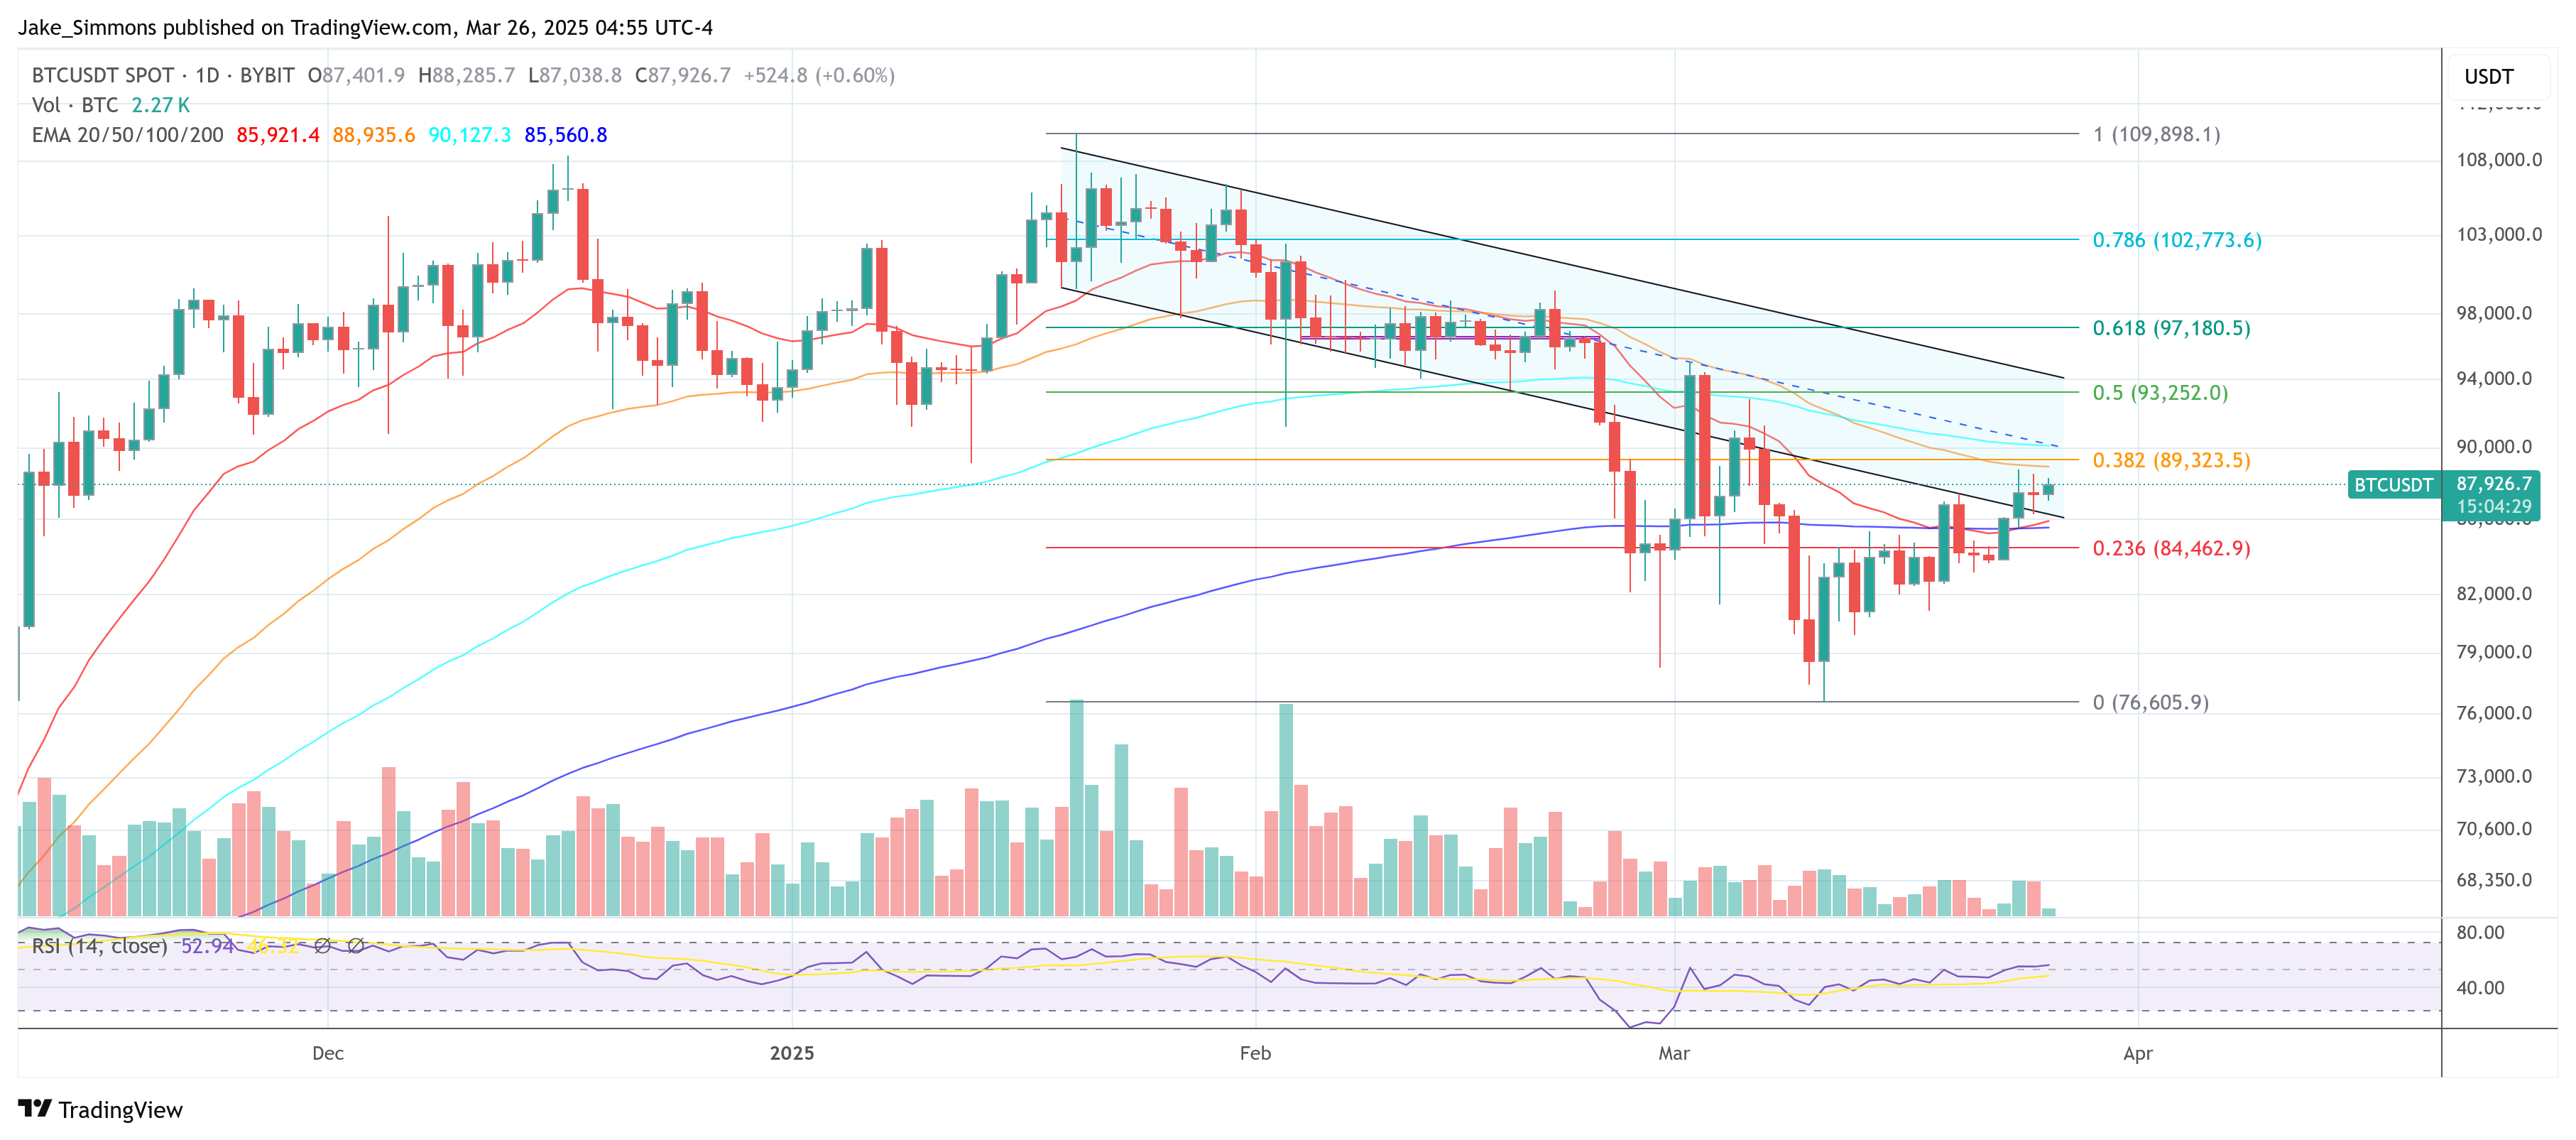
Meltem Demirors On Crypto Rally: ‘Are We So Back? Not So Fast’
Over the past two weeks, Bitcoin and the broader crypto market have seen a slight recovery. However,...