Bitcoin Price Dives Once More—Is a Deeper Correction Underway?


Bitcoin price started a fresh decline from the $92,000 zone. BTC is back below $85,500 and might continue to move down below $80,000.
- Bitcoin started a fresh decline below the $85,000 zone.
- The price is trading below $85,000 and the 100 hourly Simple moving average.
- There is a short-term bearish trend line forming with resistance at $83,200 on the hourly chart of the BTC/USD pair (data feed from Kraken).
- The pair could start another decline if it fails to clear the $80,000 resistance zone.
Bitcoin Price Faces Resistance
Bitcoin price started a fresh decline below the $88,000 level. BTC traded below the $86,000 and $85,000 support levels. Finally, the price tested the $80,000 support zone .
A low was formed at $80,006 and the price recently started a recovery wave. There was a move above the $80,500 and $81,200 resistance levels. The bulls pushed the price toward the 23.6% Fib retracement level of the downward move from the $91,060 swing high to the $80,006 low.
Bitcoin price is now trading below $85,000 and the 100 hourly Simple moving average . On the upside, immediate resistance is near the $82,700 level. The first key resistance is near the $83,000 level.
There is also a short-term bearish trend line forming with resistance at $83,200 on the hourly chart of the BTC/USD pair. The next key resistance could be $85,000. It is near the 50% Fib retracement level of the downward move from the $91,060 swing high to the $80,006 low.
A close above the $85,000 resistance might send the price further higher. In the stated case, the price could rise and test the $87,500 resistance level. Any more gains might send the price toward the $90,000 level or even $96,200.
Another Decline In BTC?
If Bitcoin fails to rise above the $83,000 resistance zone, it could start a fresh decline. Immediate support on the downside is near the $81,000 level. The first major support is near the $80,200 level.
The next support is now near the $80,000 zone. Any more losses might send the price toward the $78,000 support in the near term. The main support sits at $75,000.
Technical indicators:
Hourly MACD – The MACD is now losing pace in the bearish zone.
Hourly RSI (Relative Strength Index) – The RSI for BTC/USD is now below the 50 level.
Major Support Levels – $80,000, followed by $78,000.
Major Resistance Levels – $83,000 and $85,000.
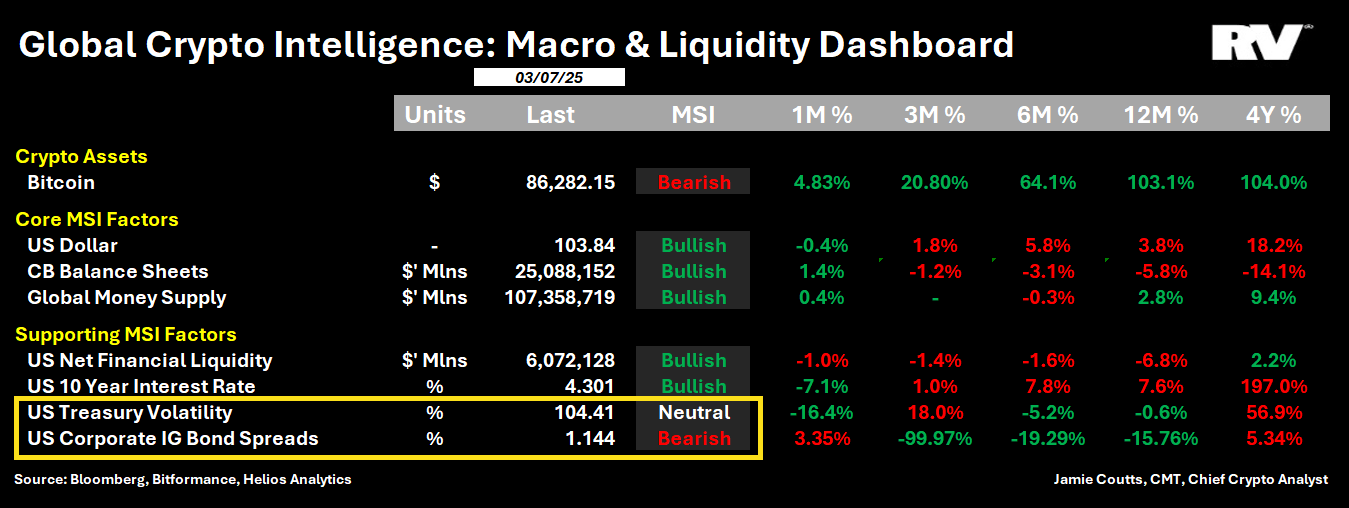
Bitcoin Plays Chicken With Central Banks As Dollar Falls, Says Expert
Bitcoin’s price endured another bout of volatility over the weekend, shedding 5% on Sunday to dip be...
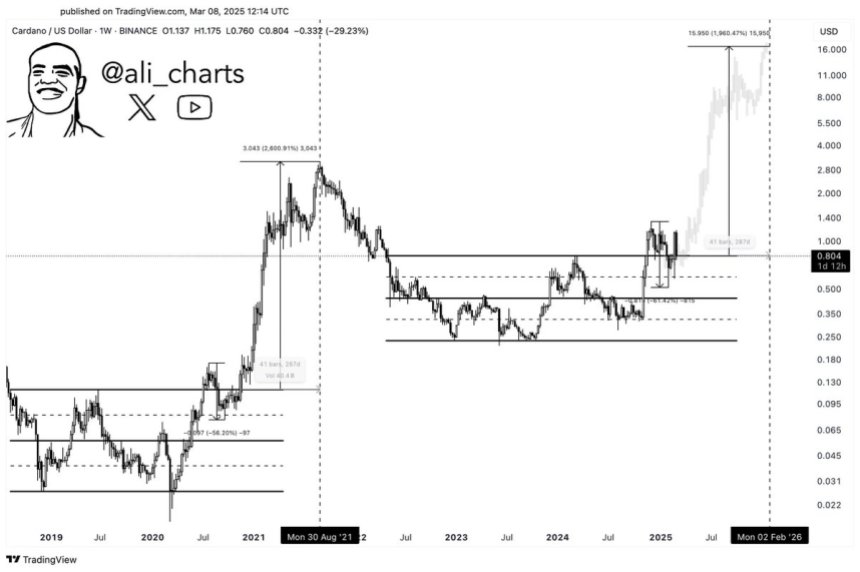
Cardano Bulls Eye $10 Target – Analyst Reveals Key Levels To Break
Cardano (ADA) has been caught in massive volatility and extreme price swings, making it one of the m...
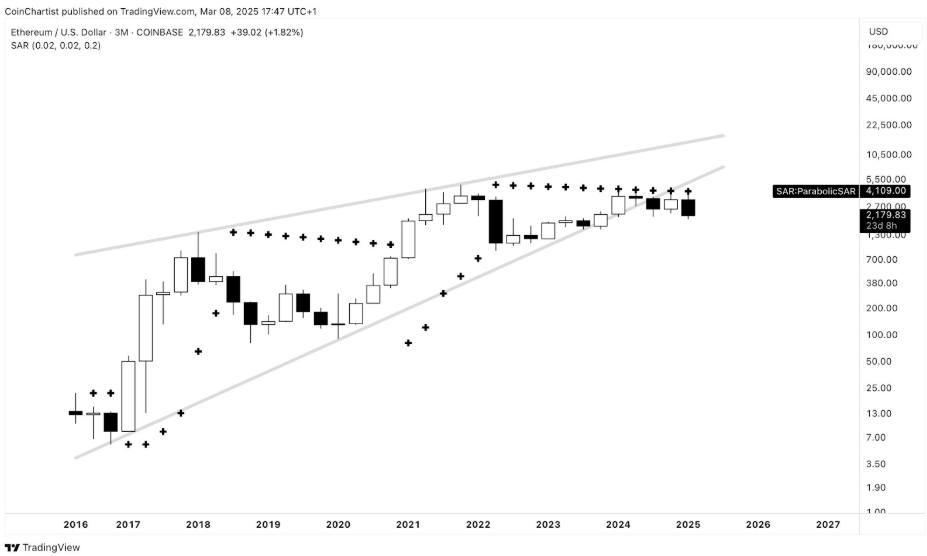
Ethereum Holds Strong For Over A Year: Monthly Close Below This Level Could Be Catastrophic
Ethereum has struggled to gain momentum, remaining stuck below critical resistance for over a year. ...