XRP Price Slips, But Buyers Hold Ground—Is a Rebound Coming?


XRP price started a fresh recovery wave from the $2.20 zone. The price is now consolidating and might struggle to clear the $2.50 resistance zone.
- XRP price started a decent upward move from the $2.20 support zone.
- The price is now trading below $2.50 and the 100-hourly Simple Moving Average.
- There was a break below a connecting bullish trend line with support at $2.550 on the hourly chart of the XRP/USD pair (data source from Kraken).
- The pair might continue to move up if it clears the $2.5350 resistance zone.
XRP Price Faces Hurdles
XRP price started a recovery wave from the $2.20 zone, like Bitcoin and Ethereum . The price was able to climb above the $2.40 and $2.50 resistance levels. However, the bears were active near $2.640.
The price corrected some gains and dipped below $2.550. There was a break below a connecting bullish trend line with support at $2.550 on the hourly chart of the XRP/USD pair. The pair dipped below the 50% Fib retracement level of the upward move from the $2.211 swing low to the $2.6390 high.
The price is now trading below $2.550 and the 100-hourly Simple Moving Average. On the upside, the price might face resistance near the $2.50 level. The first major resistance is near the $2.5350 level.
The next resistance is $2.640. A clear move above the $2.640 resistance might send the price toward the $2.720 resistance. Any more gains might send the price toward the $2.80 resistance or even $2.850 in the near term. The next major hurdle for the bulls might be $3.00.
Another Decline?
If XRP fails to clear the $2.5350 resistance zone, it could start another decline. Initial support on the downside is near the $2.4250 level. The next major support is near the $2.3750 level and the 61.8% Fib retracement level of the upward move from the $2.211 swing low to the $2.6390 high.
If there is a downside break and a close below the $2.3750 level, the price might continue to decline toward the $2.320 support. The next major support sits near the $2.20 zone.
Technical Indicators
Hourly MACD – The MACD for XRP/USD is now losing pace in the bullish zone.
Hourly RSI (Relative Strength Index) – The RSI for XRP/USD is now below the 50 level.
Major Support Levels – $2.4250 and $2.3750.
Major Resistance Levels – $2.5350 and $2.640.
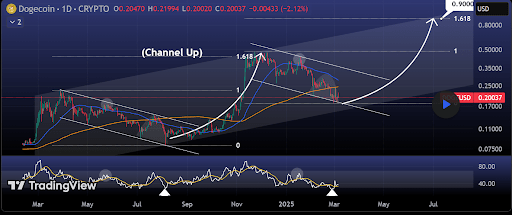
Dogecoin Price Turns Bullish With 1-Day RSI In Oversold Region, Why DOGE Can Reach $0.9
Dogecoin has been trading in a bearish momentum in the past few weeks, which has caused its price to...
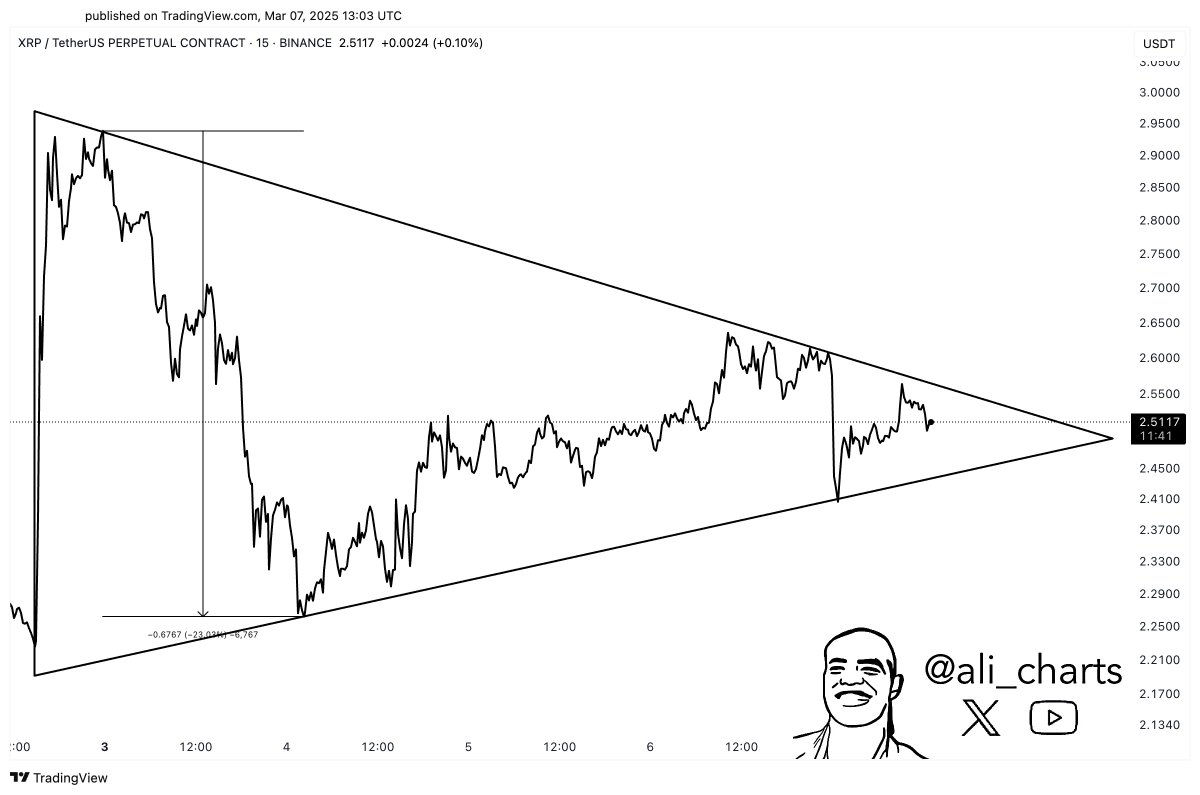
XRP Price Is Consolidating Within This Pattern — What’s Next?
The XRP price performance has been one of the bright spots in the cryptocurrency market over the pas...
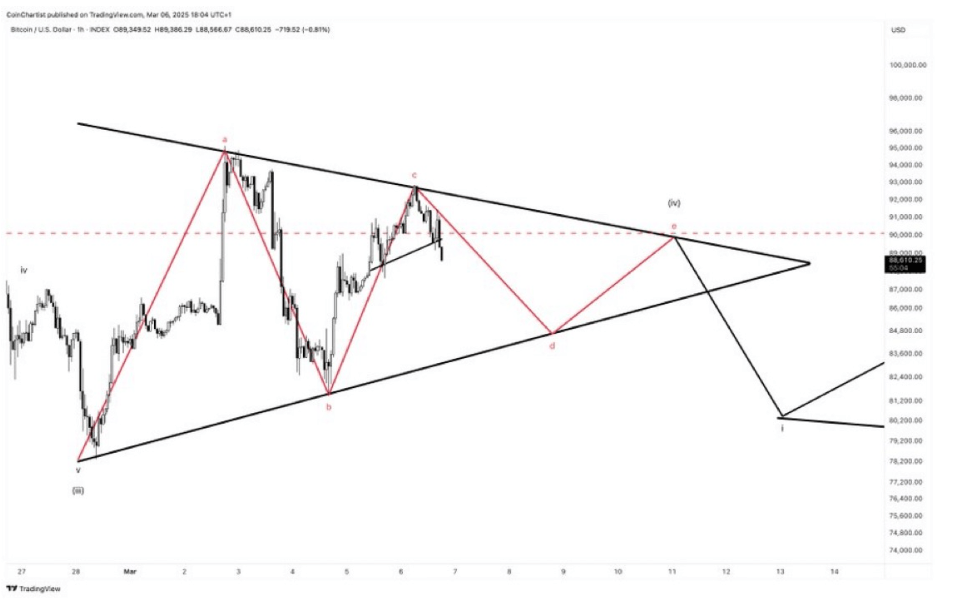
Bitcoin Price Forecast: LTF Head And Shoulders Pattern Predicts Crash – Here’s The Target
Tony Severino, a prominent crypto analyst, has shared a new Bitcoin price forecast, suggesting that ...