XRP Bulls on Edge—Could the Downtrend Continue?


XRP price started a fresh decline below the $2.650 resistance. The price is now consolidating losses and might face resistance near the $2.550 zone.
- XRP price started a fresh decline below the $2.650 zone.
- The price is now trading above $2.40 and the 100-hourly Simple Moving Average.
- There is a short-term rising channel forming with support at $2.40 on the hourly chart of the XRP/USD pair (data source from Kraken).
- The pair might continue to move down if it remains below the $2.550 resistance zone.
XRP Price Faces Resistance
XRP price started a fresh decline from the $3.00 resistance, like Bitcoin and Ethereum . The price dipped below the $2.80 and $2.60 levels.
The bears were able to push the price below the 50% Fib retracement level of the upward move from the $1.95 swing low to the $3.00 high. Finally, the bulls appeared near the $2.20 support zone. A base is forming and the price is now attempting to recover above $2.30.
The price is now trading above $2.40 and the 100-hourly Simple Moving Average. There is also a short-term rising channel forming with support at $2.40 on the hourly chart of the XRP/USD pair.
On the upside, the price might face resistance near the $2.550 level. The first major resistance is near the $2.650 level. The next resistance is $2.750. A clear move above the $2.750 resistance might send the price toward the $2.80 resistance.
Any more gains might send the price toward the $2.880 resistance or even $2.920 in the near term. The next major hurdle for the bulls might be $3.00.
Another Decline?
If XRP fails to clear the $2.550 resistance zone, it could start another decline. Initial support on the downside is near the $2.40 level. The next major support is near the $2.320 level.
If there is a downside break and a close below the $2.320 level, the price might continue to decline toward the $2.20 support and the 76.4% Fib retracement level of the upward move from the $1.95 swing low to the $3.00 high. The next major support sits near the $2.120 zone.
Technical Indicators
Hourly MACD – The MACD for XRP/USD is now losing pace in the bearish zone.
Hourly RSI (Relative Strength Index) – The RSI for XRP/USD is now above the 50 level.
Major Support Levels – $2.40 and $2.320.
Major Resistance Levels – $2.550 and $2.750.
Buy Dogecoin Now? Analyst Says This Is the Spot
Crypto analyst Kevin (known on X as @Kev_Capital_TA) has outlined what he deems a potentially ideal ...
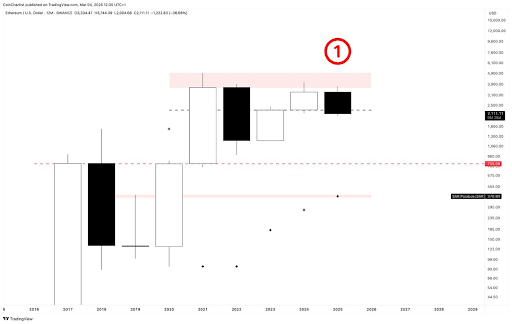
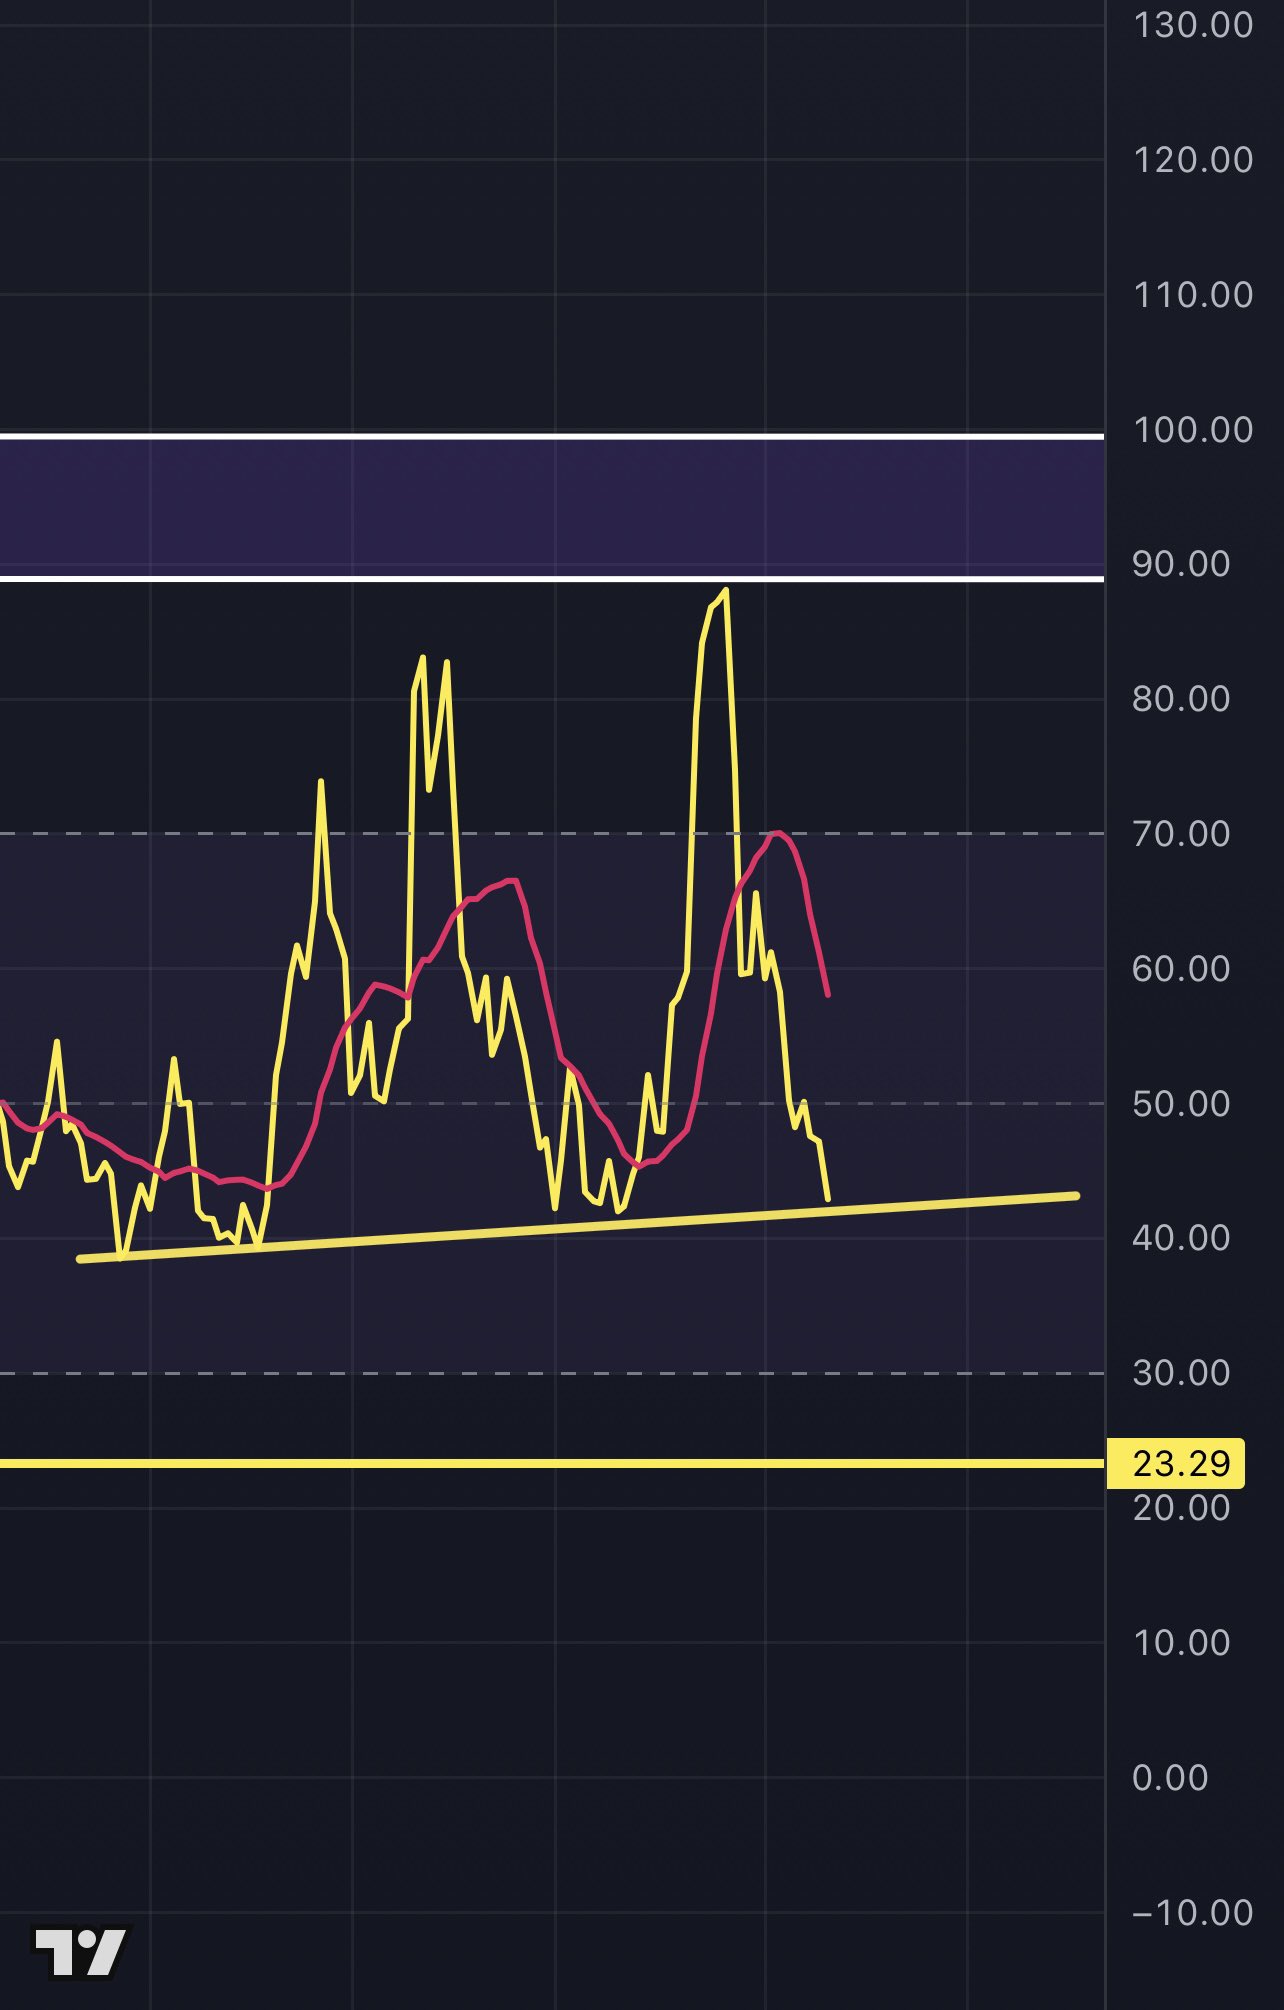
Ethereum In 2024 Vs. 2025: What Important Technical Indicators Are Saying
Crypto analyst Tony Severino has drawn similarities between Ethereum’s price action in 2024 and this...
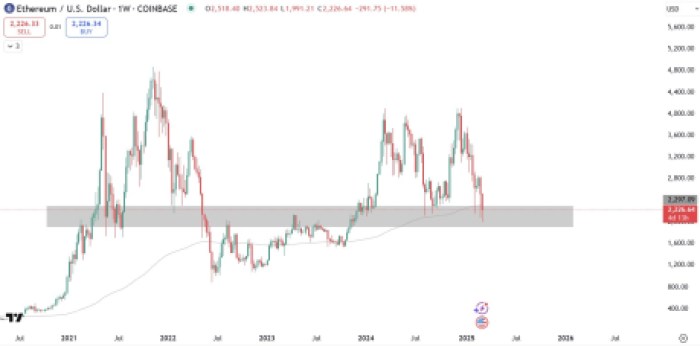
Ethereum 2025 Price Prediction as Trump Announces US Crypto Reserve
Following its inclusion in Donald Trump’s newly announced US Crypto Reserve, Ethereum’s price predic...